
The EUR/USD pair remains inside the trading range between 1.1450-1.1270. In the short term, the trend remains neutral. However, today, we will take a look at the bigger picture and see that the bullish scenario is more likely.
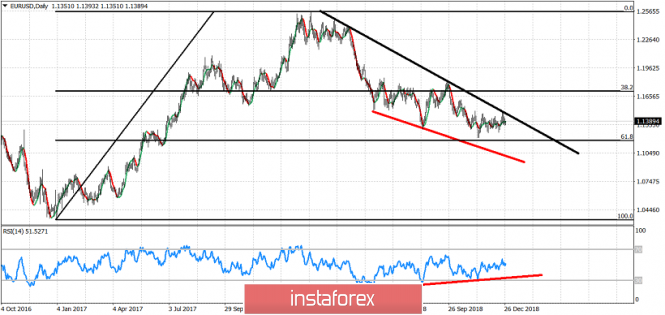
Black downward sloping line - major trend line resistance
The EUR/USD pair has stopped the decline from 1.2555 at the level very close to the important support at 1.1215 where we find the 61.8% Fibonacci retracement level. This Fibonacci level is very important support and we often see trend reversals from this area. Additionally, on the daily chart, we can observe a three drive pattern in the RSI where the new lows in the price are not followed by the new lows in the RSI. These are all bullish indications and warnings to bears. But from the technical point of view, the trend has not changed yet. Bulls will need to break and close above 1.1450-1.1470 and the black downward sloping trend line in order for the trend to change.
The material has been provided by InstaForex Company - www.instaforex.com