
Gold price is trading around $1,224 remaining in a bullish short-term trend. Price is now above the 61.8% Fibonacci retracement but the upward momentum has weakened according to the 4hour RSI. I expect Gold to pull back or start a new downward move from current levels.
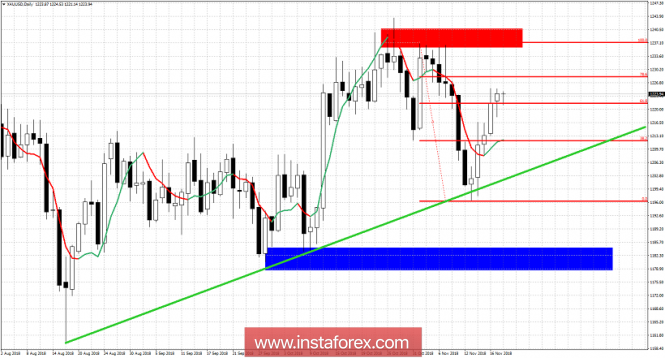
Blue rectangle - major support
Green trend line - short-term trend support
Gold price is making higher highs and higher lows in small time frames. However in the Daily chart we remain below the key resistance of $1,243.50. Gold price shows bearish divergence RSI signs in the 4 hour chart and if short-term support at $1,218 is broken, I will assume that the entire bounce is over and we should at least challenge the green trend line at $1,210-$1,205 area. Gold price has important support at $1,196 that if broken, we will see prices move towards the blue rectangle area at least. If the red rectangle resistance is broken Gold could rally 20$ higher. I continue to consider this bounce as a selling opportunity with stops at the highs of October and remain bearish as long as we trade below that area.
The material has been provided by InstaForex Company - www.instaforex.com