
EUR/USD is in a bullish short-term trend since bottoming around 1.1215. Our first target of 1.13 was reached and our next target of 1.1450-1.15 is also accomplished. There are no bearish divergence signs in short time frames but bulls should be very cautious from now on.
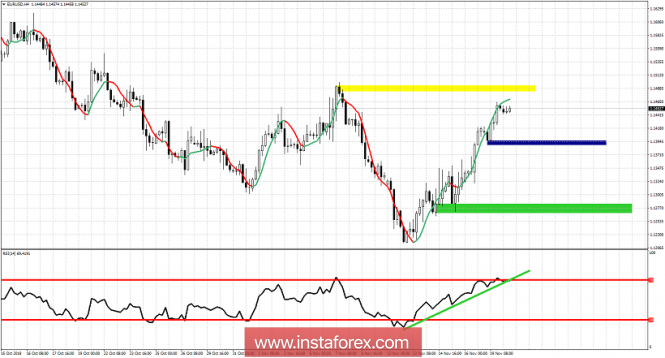
Blue rectangle - short-term support
Green rectangle - trend support
Green line - trend line support
EUR/USD is approaching its last high. This is resistance area. Support is at 1.14-1.1390. If broken we would have the first weakness sign. If this happens we would most probably have a break of the green RSI trend line. We are very close to breaking it. Price of the RSI is marginally holding above it. So bulls need to be very careful as the RSI is reaching overbought levels. A break below the green rectangle area will confirm that we are in a new downward leg towards 1.1050. Breaking above 1.15 area would be a bullish sign but price should not be chased by bulls at current levels.
The material has been provided by InstaForex Company - www.instaforex.com