MG Network

something big isHappening!

In the mean time you can connect with us with via:

Copyright © Money Grows Network | Theme By Gooyaabi Templates

Money Grows Network

Archive

Powered by Blogger.

Welcome To Money Grows Network

Verified By

2006 - 2019 © www.moneygrows.net

Investments in financial products are subject to market risk. Some financial products, such as currency exchange, are highly speculative and any investment should only be done with risk capital. Prices rise and fall and past performance is no assurance of future performance. This website is an information site only.

Popular

Pages

Expert In

Name*


Message*

Technical analysis of Gold for October 24, 2018

Gold price broke above the triangle pattern as we expected and reached $1,240. Price is now pulling back down towards the break out area. Holding above it is a bullish sign. Breaking below $1,220 would confirm the end of the upward move and the start of a new down trend.

analytics5bd018112d8e3.png

Green lines - triangle pattern (broken upwards)

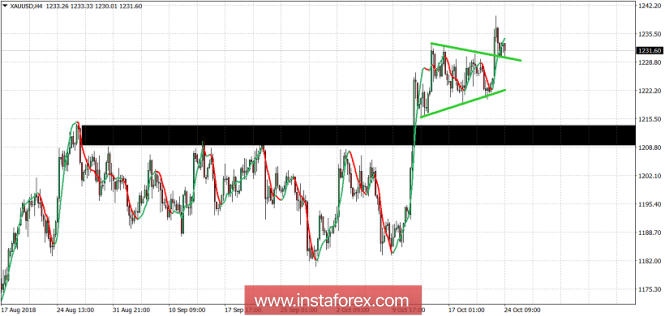
Black rectangle - major support

Gold price is in a bullish short-term trend. Price broke above the triangle pattern and is now trading above the break out level. Gold price could continue its move higher towards $1,250-60 as long as it does not fall below $1,220. Bulls should raise their stops to protect gains.

The material has been provided by InstaForex Company - www.instaforex.com