MG Network

something big isHappening!

In the mean time you can connect with us with via:

Copyright © Money Grows Network | Theme By Gooyaabi Templates

Money Grows Network

Archive

Powered by Blogger.

Welcome To Money Grows Network

Verified By

2006 - 2019 © www.moneygrows.net

Investments in financial products are subject to market risk. Some financial products, such as currency exchange, are highly speculative and any investment should only be done with risk capital. Prices rise and fall and past performance is no assurance of future performance. This website is an information site only.

Popular

Pages

Expert In

Name*


Message*

Technical analysis of Gold for October 23, 2018

Gold price continues to trade inside the short-term triangle pattern. Price pulled back yesterday towards the lower triangle boundary and support was held. I expect the triangle to break to the upside and push prices towards $1,245-50 where I would like to take profits.

analytics5bcec8cd8731b.png

Black rectangle - major support area

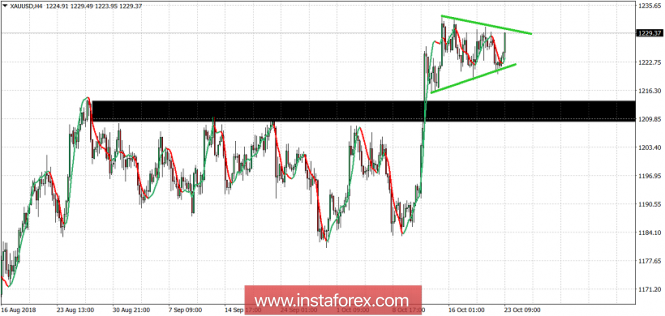
Green lines - short-term triangle pattern

Gold price has resistance at $1,231 and support at $1,222. Price could continue to trade inside the triangle pattern but in the end I expect a break to the upside. I will be taking profits above $1,240 as I believe the triangle patterns precede the final part of a trend. So the break out I expect I believe will be the last part of the rise from August lows.

The material has been provided by InstaForex Company - www.instaforex.com