
To open long positions for GBP / USD, you need:
Speech of the Bank of England Governor Mark Carney supported GBP / USD. Pound buyers managed to gain a foothold above 1.3119 in the first half of the day, and while the trade is being conducted over this range, demand for the pound will remain, which opens a direct road to new weekly highs near 1.3165 and 1.3214, where I recommend fixing the profits. If you return to the support level of 1.3119 in the second half of the day, it is best to look at long positions in the pair after correction to the support area of 1.3086, on a false breakout, or on a rebound from 1.3042.
To open short positions for GBP / USD, you need:
Pound sellers need a return to the support level of 1.3119, which recently acted as a resistance. A decrease in GBP / USD for this area in the second half of the day may cause the profit of large players to be fixed at the end of the week, which will lead to a stronger downward correction to the area of 1.3086 and 1.3042, where I recommend fixing the profits. In the case of further growth of the pound, good levels for selling remain weekly highs around 1.3165 and 1.3214.
Indicator signals:
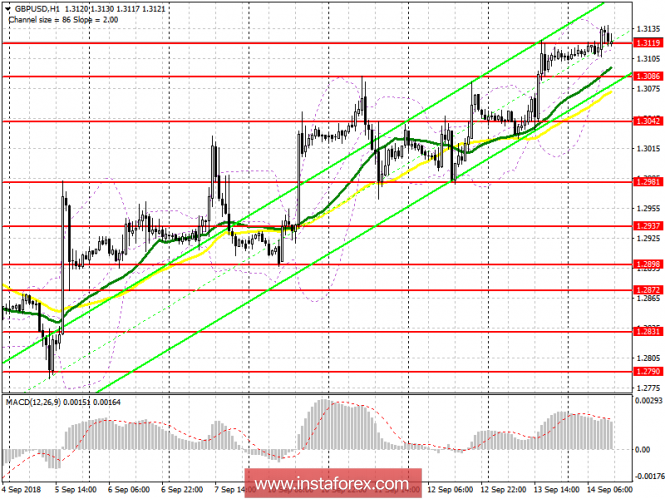
The 30-day moving average is above the 50-day moving average, which indicates the development of an uptrend - a signal to buy from large support levels with a decline.
Description of indicators
MA (average sliding) 50 days - yellow
MA (average sliding) 30 days - green
MACD: fast EMA 12, slow EMA 26, SMA 9
Bollinger Bands 20
The material has been provided by InstaForex Company - www.instaforex.com