
Gold price has made a marginal new high during the US session and is now pulling back down. Price could not push above $1,200. Gold price has stopped its rise at a major resistance area. A pullback towards $1,180 is justified.
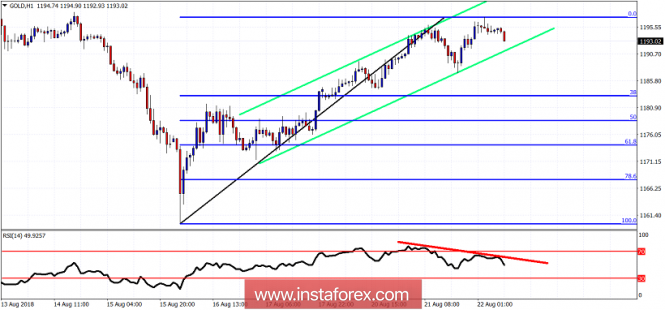
Red line - bearish divergence
Gold price is trading inside a bullish channel. Once we break support at $1,191, we should expect at least a pullback towards the 38% or even the 61.8% Fibonacci retracement area. If the price pulls back and makes a higher low, we should be optimistic that a major low is in and the next leg up will at least push towards $1,250. If however, the price starts making lower lows and lower highs, we should expect a move towards $1,140. As far as trading is concerned, short-term traders can short Gold as long as the price is below $1,200-$1,205 looking for a move towards $1,180 at least if not new lows towards $1,140. Gold bulls can try and go long near $1,175 with August lows as stop.
The material has been provided by InstaForex Company - www.instaforex.com