MG Network

something big isHappening!

In the mean time you can connect with us with via:

Copyright © Money Grows Network | Theme By Gooyaabi Templates

Money Grows Network

Archive

Powered by Blogger.

Welcome To Money Grows Network

Verified By

2006 - 2019 © www.moneygrows.net

Investments in financial products are subject to market risk. Some financial products, such as currency exchange, are highly speculative and any investment should only be done with risk capital. Prices rise and fall and past performance is no assurance of future performance. This website is an information site only.

Popular

Pages

Expert In

Name*


Message*

Technical analysis of Gold for July 27, 2018

The Gold price remains trapped inside the wedge pattern. The price got rejected at the $1,230-35 resistance area and is now challenging short-term support at $1,220-17 area. A break below this area will open the way for a push lower towards $1,200-$1,180. A break above $1,235 will open the way for a move towards $1,245-50.

analytics5b5abea2d7f3a.png

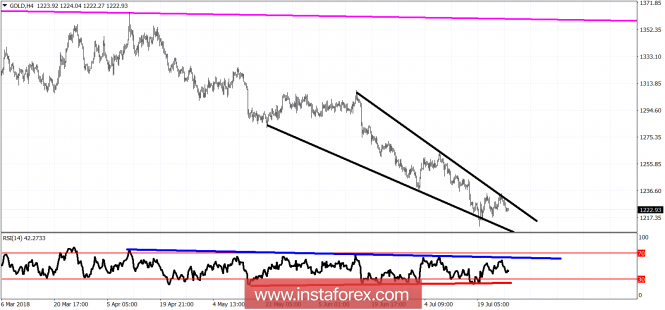
Black lines - downward sloping wedge pattern

Blue line - RSI resistance

Red line - bullish divergence RSI Support

The Gold price could make a new low towards $1,207 where the lower wedge pattern boundary is found. The $1,200-$1,205 area is the next important support. So far trend remains bearish as we see price making lower lows and lower highs. Only a break above $1,235 will change this. The bullish divergence justifies that it is time for a strong bounce but does not guarantee it. We need to break the blue RSI resistance and the $1,235 level first.

The material has been provided by InstaForex Company - www.instaforex.com