
Bitcoin has broken out of the long-term downward sloping wedge pattern. The downtrend that started back in December of 2017 is most probably over. Price has started a bounce, so that I expect to see eventually the 13,000-14,000 price level.
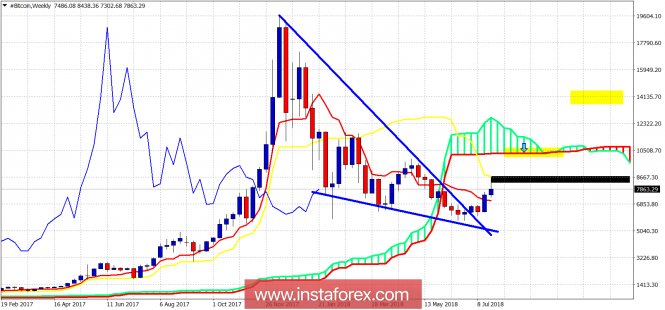
Blue lines - bullish wedge
Black rectangle - major medium-term resistance
Yellow rectangles - targets
Bitcoin has started an upward move from the 6,000$ area and is now challenging important resistance at 8,300-8,700$. If price manages to break above the black rectangular area we should expect at least a move towards the first yellow rectangular area and the lower cloud boundary around at 10,200$. A break above 10,500$ will open the way for a move towards 13,600-14,500$. Bulls are regaining control of the trend but only a weekly close above 8,700$ will confirm a short-term trend change. This spring BTC price hit a low at around 6,000$, which is a very important level. Bulls should not lose this level, otherwise our longer-term view for a bounce towards 13-14,000$ will be canceled.
The material has been provided by InstaForex Company - www.instaforex.com