MG Network

something big isHappening!

In the mean time you can connect with us with via:

Copyright © Money Grows Network | Theme By Gooyaabi Templates

Money Grows Network

Archive

Powered by Blogger.

Welcome To Money Grows Network

Verified By

2006 - 2019 © www.moneygrows.net

Investments in financial products are subject to market risk. Some financial products, such as currency exchange, are highly speculative and any investment should only be done with risk capital. Prices rise and fall and past performance is no assurance of future performance. This website is an information site only.

Popular

Pages

Expert In

Name*


Message*

Technical analysis of Gold for July 19, 2018

The Gold price remains in a bearish trend in 2018 lows. Gold price continues to make lower lows and lower highs. Change in trend to bullish will change only on a break above $1,245. A weekly close above this level will also be a very bullish signal.

analytics5b50379202ed9.png

Red downward sloping line - support trend line

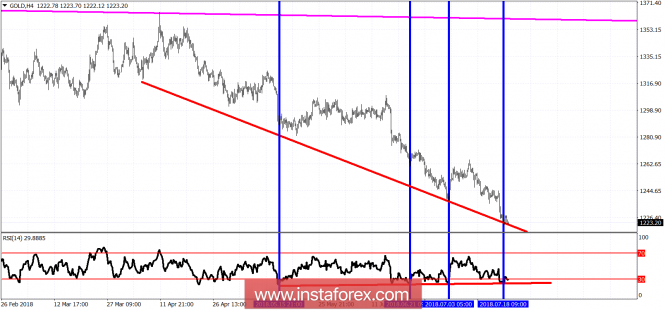
Blue lines - higher RSI lows bullish divergence

We have been noticing higher lows in the 4-hour RSI since $1,240-45 area. The new low at $1,220 was accompanied by another higher low. The end of the decline is very close for Gold. Short-term resistance is at $1,235 and next and most important is at $1,240-45.

The material has been provided by InstaForex Company - www.instaforex.com