
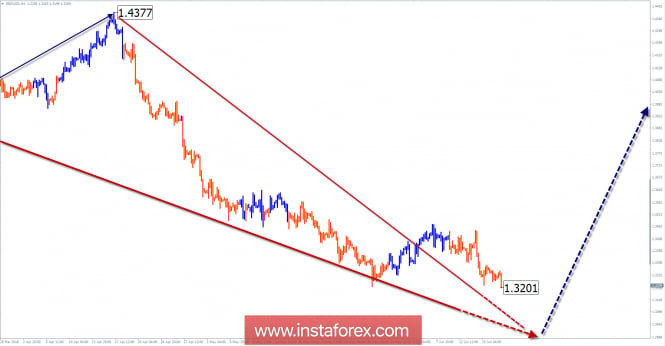
The wave pattern of the H4 graph:
The direction of short-term trends of the major pound from January 25 this year sets the bearish wave algorithm. By now the structure has been formed, the preliminary goal has been achieved.
The wave pattern of the H1 graph:
The bearish wave of April 17 is the closest to this scale. It completes a larger wave model. Quotations have reached the upper boundary of the potential reversal zone.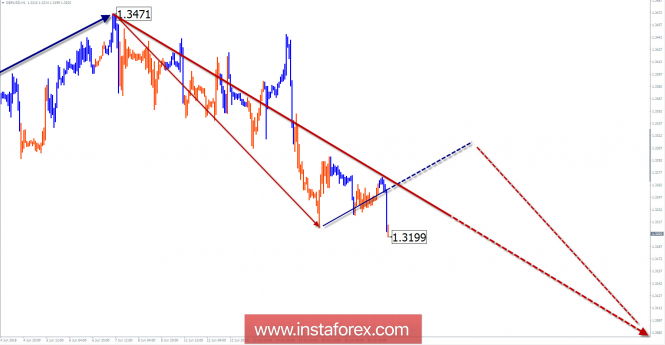
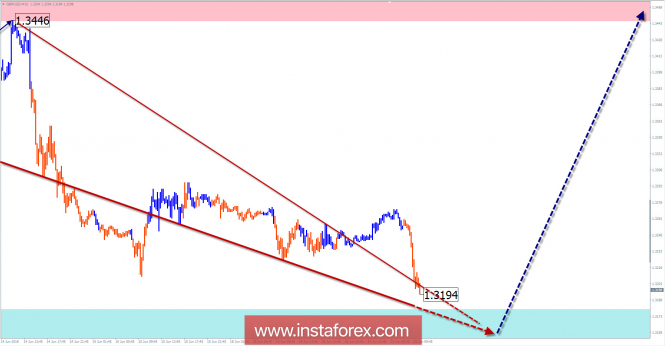
The wave pattern of the M15 chart:
The last wave can be considered a bearish section of the traffic from June 7. In the near future, within the framework of this wave, an upward pullback is expected.
Recommended trading strategy:
Sales are risky and not recommended. For all bidders, it's more logical to wait for the current bearish wave to end and look for signals to buy a pair.
Resistance zones:
- 1.3450 / 1.3500
Support zones:
- 1.3180 / 1.3130
Explanations to the figures:
A simplified wave analysis uses a simple waveform, in the form of a 3-part zigzag (ABC). The last incomplete wave for every timeframe is analyzed. Zones show the calculated areas with the greatest probability of a turn.
Arrows indicate the counting of wave according to the technique used by the author. The solid background shows the generated structure and the dotted exhibits the expected wave motion.
Attention: The wave algorithm does not take into account the duration of the tool movements in time. To conduct a trade transaction, you need to confirm the signals used by your trading systems
The material has been provided by InstaForex Company - www.instaforex.com