
Fundamental Overview: Earlier data shows The euro zone's annual rate of inflation rose more sharply than expected in May as energy prices increased, a development that will likely reinforce the European Central Bank's belief that the metric will return to its target over coming years. The European Union's statistics agency today said consumer prices in the 19 countries that use the euro were 1.9% higher than in May 2017, a jump from the 1.2% rate of inflation recorded in April, the highest level since April of last year.
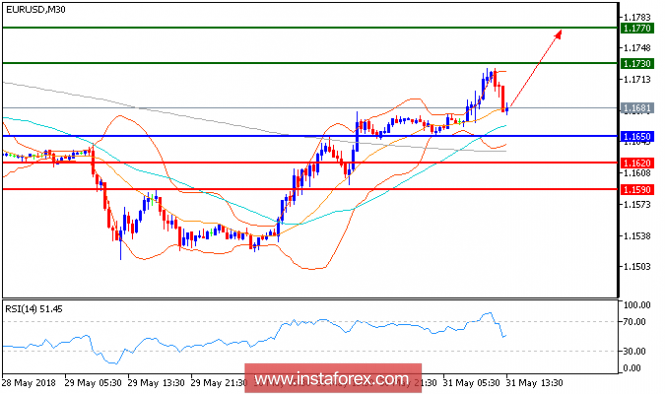
Chart Explanation: The black line shows the pivot point. Currently, the price is above the pivot point which is a signal for long positions. If it remains below the pivot point, it will indicate short positions. The red lines show the support levels, while the green line indicates the resistance levels. These levels can be used to enter and exit trades.
Resistance levels: 1.1730, 1.1770, and 1.1810
Support levels: 1.1620, 1.1590, and 1.1550
The material has been provided by InstaForex Company - www.instaforex.com