
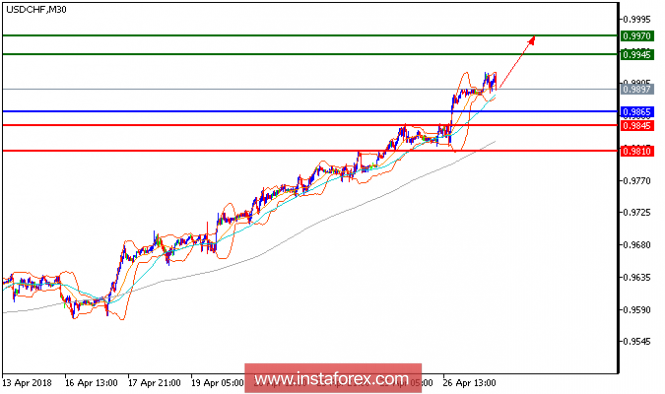
All our upside targets which we predicted yesterday have been hit. The pair is heading upward towards 0.9945, backed by its rising 20-period moving average. Furthermore, the relative strength index is bullish above its neutrality area at 50. Last but not least, the process of higher highs and lows remains intact on the prices. In these perspectives, as long as 0.9865 is not broken, look for a new rise to 0.9945 and 0.9970 in extension.
Chart Explanation: The black line shows the pivot point. The present price above the pivot point indicates a bullish position, and the price below the pivot point indicates a short position. The red lines show the support levels, and the green line indicates the resistance levels. These levels can be used to enter and exit trades.
Strategy: BUY, stop loss at 0.9865, take profit at 0.9945.
Resistance levels: 0.9945, 0.9970, and 0.9995
Support levels: 0.9845, 0.9810, and 0.9770.
The material has been provided by InstaForex Company - www.instaforex.com