
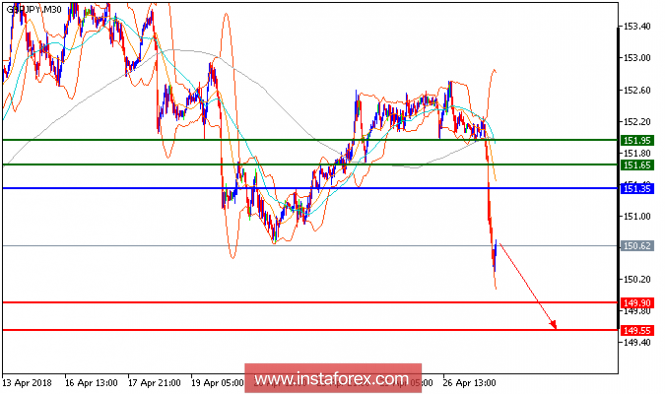
GBP/JPY is under pressure and expected to prevail its downside movement. The pair accelerated on the downside last night, following the bearish breakout of a key horizontal level at 132.80. Both the falling 20-period and 50-period moving averages act as resistance, and should continue to push the prices lower. Last but not least, the relative strength index is bearish, without showing any reversal signal. In which case, below 151.35, look for a new decline to 149.90 and 149.55 in extension.
Chart Explanation: The black line shows the pivot point. Currently, the price is above the pivot point which is a signal for long positions. If it remains below the pivot point, it will indicate short positions. The red lines show the support levels, while the green line indicates the resistance levels. These levels can be used to enter and exit trades.
Resistance levels: 151.65, 151.95, and 152.45
Support levels: 149.90, 149.55, and 149.00
The material has been provided by InstaForex Company - www.instaforex.com