
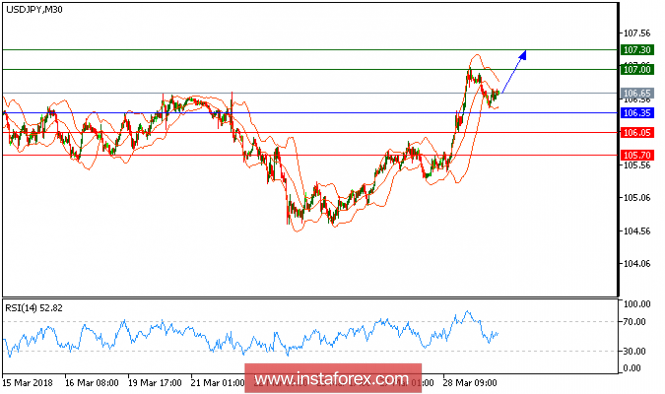
All our targets which we predicted in previous analysis have been hit. USD/JPY is still expected to trade in higher range. The pair keeps trading on the upside following a surge of over 1.4% yesterday (March 28). Extra support is provided by the ascending 20-period moving average, which stands far above the 50-period one. The relative strength index has climbed into the overbought region of the 70s without showing signs of a bearish divergence. Therefore, intraday bullishness persists, and the pair should proceed toward the key overhead resistance at 107.00 before targeting 107.30.
Chart Explanation: The black line shows the pivot point. The present price above the pivot point indicates a bullish position, and the price below the pivot point indicates a short position. The red lines show the support levels, and the green line indicates the resistance levels. These levels can be used to enter and exit trades.
Strategy: BUY, stop loss at 106.35, take profit at 107.00
Resistance levels: 107.00, 107.30, and 107.60
Support levels: 106.05, 105.70, and 105.15.
The material has been provided by InstaForex Company - www.instaforex.com