
Our all downside targets which we predicted in previous analysis have been hit. The pair remains under pressure below its descending trend line. The nearest key resistance at 1.3790 should limit any upward attempts. Besides, the relative strength index is mixed to bearish.
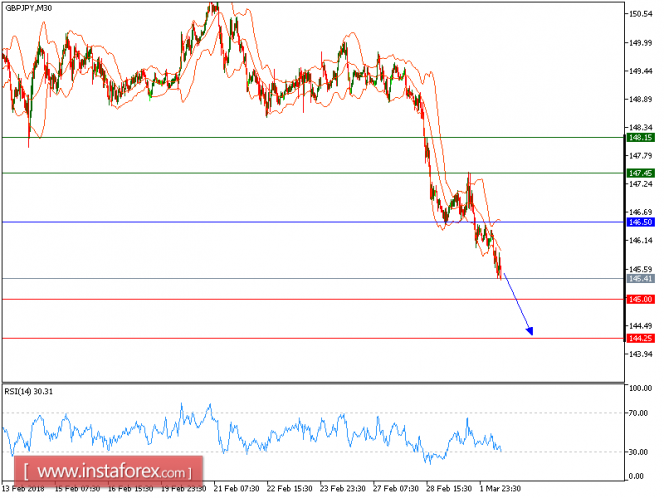
Hence, as long as 146.50 is not surpassed, look for a new pullback to 145 and 144.25 in extension.
Alternatively, if the price moves in the direction opposite to the forecast, a long position is recommended to be above 146.50 with the target at 147.45.
Strategy: SELL, Stop loss at 146.50, Take profit at 145.00
Chart Explanation: The black line shows the pivot point. The price above the pivot point indicates long positions; and when it is below the pivot point, it indicates short positions. The red lines show the support levels, and the green line indicates the resistance levels. These levels can be used to enter and exit trades.
Resistance levels: 150.00, 150.50, and 151.00
Support levels: 148.50, 147.95, and 147.50
The material has been provided by InstaForex Company - www.instaforex.com