
The Gold price remains inside the trading range of $1,300-$1,350. Price is moving above and below the 4-hour cloud for the last couple of weeks. There is no clear trend. This is better depicted in the Daily chart as price remains inside the cloud.
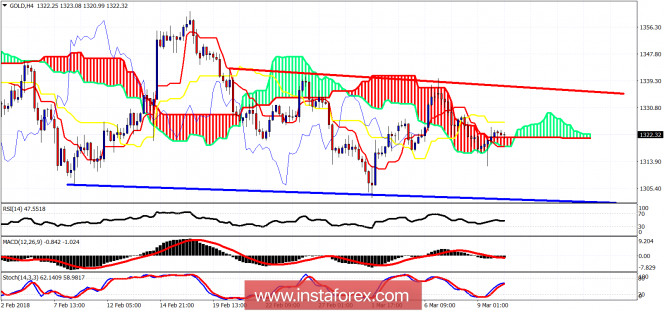
Red line - resistance
Blue line - support
The price is trading again above the 4hour Ichimoku cloud. The price reached again just above the $1,310 area and bounce towards the cloud area. Support is at $1,312.50 and resistance at the kijun-sen (yellow line indicator) at $1,326. There is no clear short-term trend.
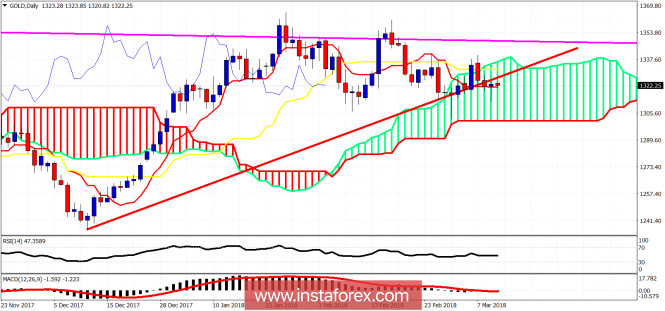
Magenta line - long-term resistance
Red line - support trend line
On a daily basis, the Gold price is inside the Daily Kumo. Trend is neutral. Support is at $1,300 while resistance is at $1,337-40. Long-term resistance is at $1,350 and we will get very bullish on a break above that area. Until then we prefer to remain cautious.
The material has been provided by InstaForex Company - www.instaforex.com