
Technical outlook:
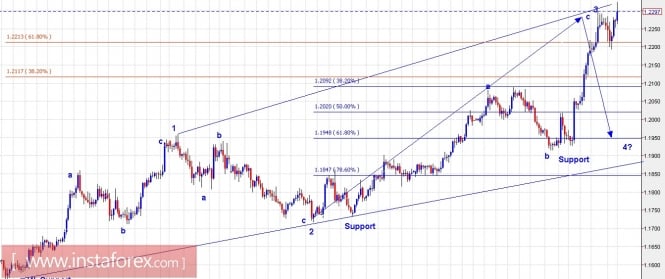
A 4H chart view has been presented here which highlights the last wave (5) which could be unfolding as 5 waves at this point. As labeled here, it is quite possible that 3 waves might have completed with EURUSD spiking to new highs at 1.2323 levels and that wave 4 might be looking lower now. This could bring back prices back to 1.1900/50 handle before rallying into the last wave 5. On the flip side, a drop below 1.1900 levels and subsequently the line of support, would indicate that a major top has been formed and EURUSD is now headed lower. In either case, a bearish bias is favored for now. Please allow 1.2200 levels to break again, before attempting short positions again. Bearish divergences are strongly witnessed on the RSI and MACD oscillators.
Trading plan:
Look to sell again now (aggressive) or on a break below 1.2200 levels, stop above 1.2323, the target is open.
US Dollar Index chart setups:
Technical outlook:
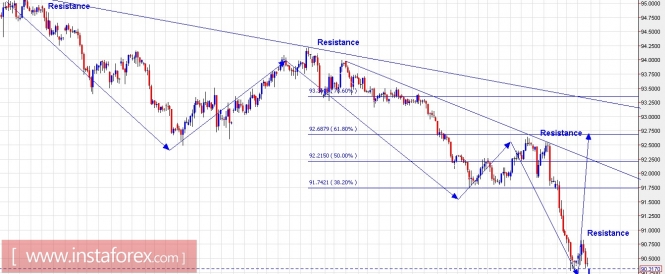
The US Dollar Index 4H chart view has been presented here to highlight its last wave (5) unfolding. lower. It is quite evident that at least wave 3 has been terminated now with another intraday low being printed at 90.21 levels. The most likely direction should be a push higher towards 92.70 levels, which could be a potential wave 4 termination point. On the flip side, a push higher towards 94.25 and above levels would indicate that a major bottom is in place in the US Dollar Index at 90.21 levels and that a meaningful corrective rally should be in place now. Bullish divergences are strongly witnessed on RSI and MACD oscillators now and hence a turn is almost inevitable. It remains to be seen when would bulls take control back and break the first resistance at 90.80 levels.
Trading plan:
Please remain long with a stop at 90.00 or go long on a break above 90.80 levels.
Fundamental outlook:
Watch out for Bank of Canada rate decision at 1000 AM EST.
Good luck!
The material has been provided by InstaForex Company - www.instaforex.com