
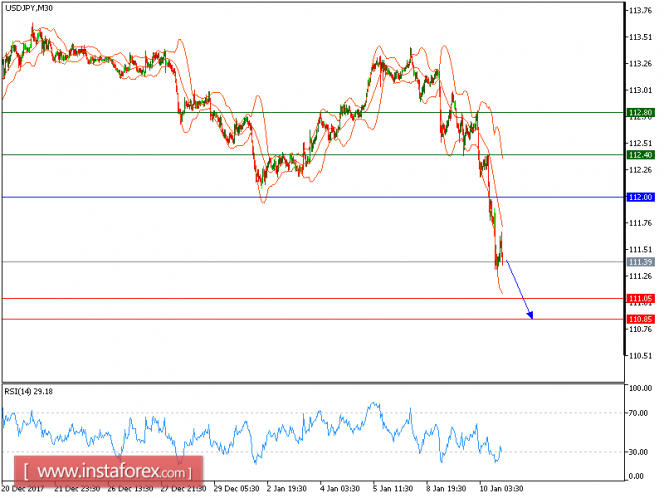
USD/JPY is under pressure. The pair remains capped by the key resistance at 112.00 as well as the descending 50-period moving average. Currently, it is trading at levels around the 20-period moving average. And the relative strength index is yet to recover the neutrality level of 50. Intraday bearishness persists, and the pair is expected to pull back to 111.05 before declining further to 110.85.
Alternatively, if the price moves in the opposite direction, a short position is recommended below 112.00 with a target of 112.40.
Chart Explanation: The black line shows the pivot point. The current price above the pivot point indicates a bullish position, while the price below the pivot point is a signal for a short position. The red lines show the support levels and the green line indicates the resistance level. These levels can be used to enter and exit trades.
Strategy: SELL, stop loss at 112.00, take profit at 111.05.
Resistance levels: 112.40, 112.80, and 113.25
Support levels: 111.05, 110.85, and 110.50.
The material has been provided by InstaForex Company - www.instaforex.com