
Daily Outlook
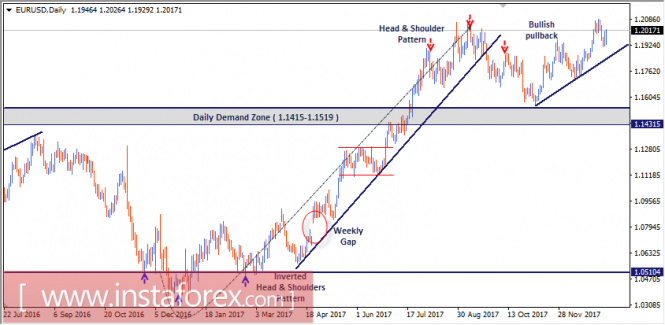
As anticipated, the ongoing bullish momentum allowed the EUR/USD pair to pursue further bullish advance towards 1.1415-1.1520 (Previous Daily Supply-Zone).
The daily supply zone failed to pause the ongoing bullish momentum. Instead, evident bullish breakout was expressed towards the price level of 1.2100 where the depicted Head and Shoulders reversal pattern was expressed.
If the recent bearish breakout persists below 1.1700 (Neckline of the reversal pattern), a quick bearish decline should be expected towards the price zone of 1.1415-1.1520 (Initial targets for the depicted H&S pattern).
Bearish target for the depicted Head and Shoulders pattern extends towards 1.1350. However, to pursue towards the mentioned target level, significant bearish pressure is needed to be applied against the mentioned zone (1.1415-1.1520).
However, In November, recent price action around the price zone of 1.1520-1.1415 indicated evident bullish recovery.
This hindered further bearish decline which allowed the current bullish pullback to occur towards the price level of 1.2000-1.2100 where price action should be watched for a valid SELL entry (Note the bearish engulfing daily candlesticks of the previous few days).
On the other hand, daily persistence above 1.2100 confirms the depicted bullish continuation pattern with projected targets towards 1.2500.
H4 Outlook
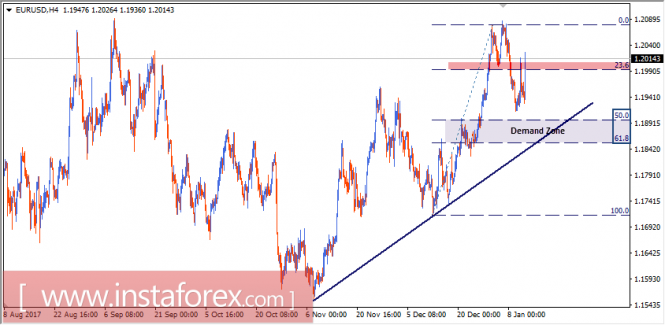
On November 7, a short-term uptrend was initiated around 1.1570 Since then, the EUR/USD pair has been moving higher as depicted on the chart.
Recently, a double-top reversal pattern was established around the price levels of 1.2080. This was followed by bearish breakdown below 23.6% Fibonacci level (1.1990).
As long as the EUR/USD pair is trading below 1.1990-1.2020, More bearish decline should be expected towards the price zone of 1.1890-1.1850 (Demand-Zone) where the uptrend line comes to meet the depicted Fibonacci levels.
The price zone (1.1990-1.2020) remains an intraday supply zone to be watched for short-term SELL entries.
On the other hand, price action should be watched around the depicted demand zone (1.1890-1.1850) for significant bullish rejection and a possible BUY entry.
Bearish breakdown below 1.1850 ( 61.8% Fibonacci ) will be a valid SELL signal if enough bearish pressure is applied against the mentioned zone.
The material has been provided by InstaForex Company - www.instaforex.com