
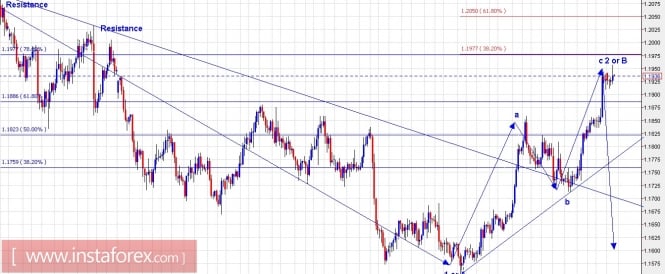
Technical outlook:
The EUR/USD pair has finally pushed through the expected levels, extremely close to 1.1950/75 today. The pair again remained shy of testing its resistance at 1.1975 levels before retracing lower. Please note that there still remains a good probability for a push through the fibonacci convergence at 1.1975, before finally reversing lower again. The wave count also provides enough clarity now as labelled here. The entire drop from 1.2092 levels can be defined as wave 1 or A, while the subsequent rally, which has unfolded into 3 waves a-b-c can be defined as wave 2 or B. If this count holds to be true, the next probable move should be a drop lower towards 1.1480 or lower levels. Please note, that the pair is unfolding into a 3 or 5 wave structure lower from current levels. Prices should now ideally remain below 1.2092 levels, moving forward.
Trading plan:
Please remain short, risk above 1.2092, target 1.1480.
US Dollar Index chart setups:
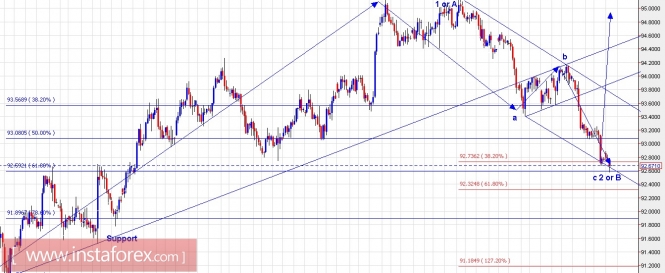
Technical outlook:
The US Dollar Index chart has followed the proposed wave count to absolute perfection. We have been discussing the possibility of a drop to 92.60 since last several trading sessions which was achieved today. No matter we could not capitalize on the drop completely, now is the opportunity to ride the wave higher. The index seems to have completed wave 1or A, through its rally between 91.00 and 95.00 levels respectively. The subsequent drop is in 3 waves a-b-c, which also looks to be complete now. A classic up gartley was in the making, which looks to be complete at todays' lows. Also note that the pair is finding support from the fibonacci 0.618 levels of the entire rally between 91.00 and 95.00. If the above count holds to be true, the next high probability wave structure looks to be on the north side.
Trading plan:
Please remain long from here, stop at 91.00, target above 98.00.
Fundamental outlook:
No major events are lined up for the day.
Good luck!
The material has been provided by InstaForex Company - www.instaforex.com