
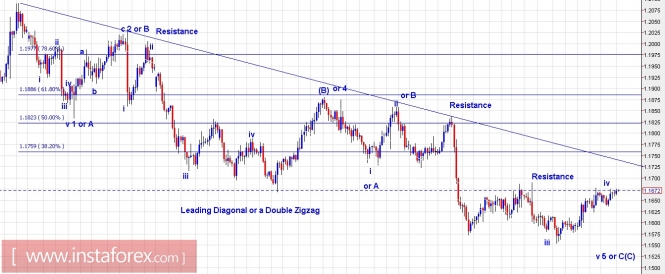
Technical outlook:
The EUR/USD pair continues to drift sideways ahead of former price resistance around 1.1690 levels as seen above. The pair is trading around 1.1670/75 levels at this moment and might be looking to turn lower one last time before producing a meaningful rally ahead. Please note that the wave structure remains unchanged from what was discussed last week. The pair is either producing a leading diagonal (5 waves) or a double zigzag corrective drop, both options are labeled above. A common point is that the pair might dip towards 1.1500/20 levels before turning higher again. A high probable wave count as labeled above is that it is working out wave iv which should terminate around current levels. If the above count holds true, we should see 1.1500/20 levels pretty soon. On the flip side, a break above 1.1690 and subsequently above trend line resistance would confirm that a meaningful bottom is in place at 1.1552 and that the next target should be higher towards at least 1.1900 levels.
Trading plan:
Conservative swing traders would want to buy below 1.1550 levels with risk at 1.1400, targeting 1.1900.
Aggressive traders might want to trade both sides.
US Dollar Index chart setups:
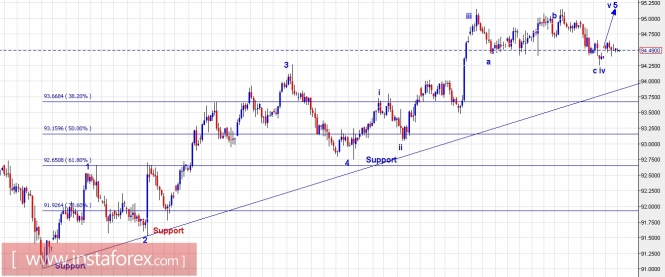
Technical outlook:
The US Dollar Index is still looking to print one more high towards 95.30/50 levels before dropping lower again as a retracement or towards fresh lows. Looking at the wave counts here, it is more clear as an impulse (5 waves), labeled here. Furthermore, it seems to have terminated into wave iv around 94.25/30 levels, within the 5th wave as shown here. If the above wave count holds true, the pair should be heading north towards 95.30/50 levels before turning lower again. Please note that 95.30/50 is also the 0.382% Fibonacci resistance of the earlier drop between 102.20/30 through 91.00 levels, wave (3) of a higher degree according to the daily charts. One should expect a bearish reaction around that price towards a retracement lower or completely towards fresh lows below 91.00 levels. Immediate price support is at 92.75 levels while resistance is at 95.35 levels respectively.
Trading plan:
Conservative swing traders should be looking to sell as close to 95.00 or 95.30 levels with risk above 96.00 targeting 92.80.
Aggressive traders might want to trade both sides.
Fundamental outlook:
Please watch out for German GBP figures at 2:00 AM EST, followed by Italian GDP figures at 04:00 AM EST, then GBP consumer and Core Consumer price index at 04:30 AM EST, and finally Yellen speech along with Draghi's and EURO zone GDP figures at 05.00 AM EST
Good luck!
The material has been provided by InstaForex Company - www.instaforex.com