MG Network

something big isHappening!

In the mean time you can connect with us with via:

Copyright © Money Grows Network | Theme By Gooyaabi Templates

Money Grows Network

Archive

Powered by Blogger.

Welcome To Money Grows Network

Verified By

2006 - 2019 © www.moneygrows.net

Investments in financial products are subject to market risk. Some financial products, such as currency exchange, are highly speculative and any investment should only be done with risk capital. Prices rise and fall and past performance is no assurance of future performance. This website is an information site only.

Popular

Pages

Expert In

Name*


Message*

Ichimoku indicator analysis of gold for November 6, 2017

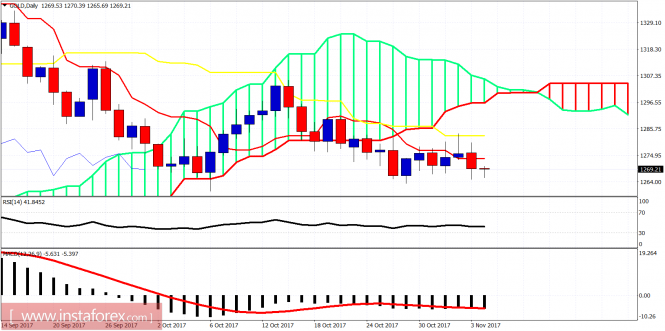
Gold price remains in a bearish trend. Price has broken again below the 4 hour Ichimoku cloud as it could not stay above $1,280 last week. Price got rejected at the important short-term resistance and that is why we closed near the lows.

analytics5a0015784d1d1.png

Black line -RSI support

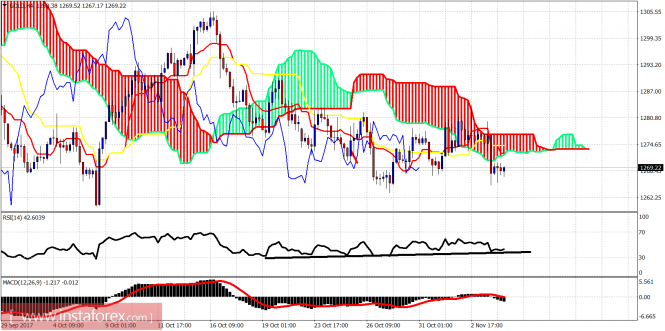
Gold price is trading below the 4 hour Kumo. The trend remains bearish. Price must break above $1,277 and close above it in order for the trend to change to bullish. Gold price continues to hold above the $1,262 low but there are increased chances of breaking below it towards $1,250-45. If the RSI support is broken, we should expect price to move towards $1,250, otherwise a bounce will come towards $1,277.

analytics5a0015fa5e523.png

Although my longer-term view remains bullish, as long as price is below the tenkan- and kijun-sen indicators, we will tend to go towards $1,245-50. Last week price got rejected at the kijun-sen (yellow line indicator) and has broken again below the tenkan-sen (red line indicator). The trend is bearish.The material has been provided by InstaForex Company - www.instaforex.com