Trading plan for 03/010/2017:
The currency market repeats the pattern from yesterday: after a sluggish start comes a clear strengthening of the USD against other major currencies. The weakest are NZD and AUD; the latter by reference to the RBA's remarks on real estate market control. EUR/USD touched 1.1694 and USD/JPY was at 113.18. GBP/USD continues yesterday's downtrend and is already at 1.3250. The stock market is rising slightly.
On Tuesday 3rd of October, the event calendar is light in important event releases, but market participants will keep an eye on Construction PMI from the UK, PPI from the Eurozone and Unemployment Change from Span. Two speeches are scheduled for today from FOMC member Jerome Powell and BOC Deputy Governor Sylvain Leduc.
GBP/USD analysis for 03/10/2017:
The Construction PMI data are scheduled for release at 08:30 am GMT and market participants expect the figures to be released still above the fifty level (51.1 points). Nevertheless, even if the level of 51.1 points is hit, it still will be the lowest Construction PMI in 12 months, with the recent 4 months presenting a clear downtrend from 55.5 level. Construction figures are an important indicator of housing demand. If PMI falls below its fifty level, then it means this sector of the economy is in contraction, which, in turn, will influence the housing sector as well.
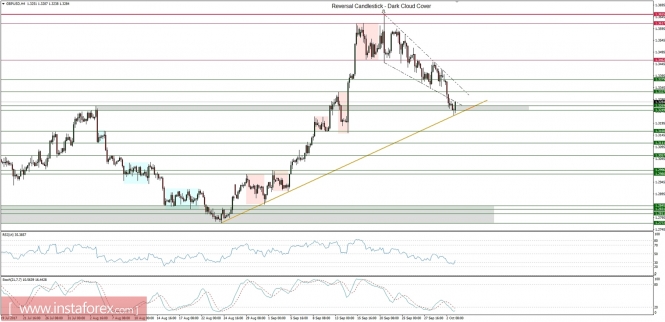
Let's take a look at the GBP/USD technical picture on the H4 time frame. The second candle with a wick at the bottom is drawn, indicating a likely upward correction. Very important resistance will be the line connecting the last peaks falling in the area of 1.3330. In case of a breakthrough in a slightly longer term, it may open the way to the September highs at 1.3660. The closest support is the Fibonacci retracement of 50%$ is at the level of 1.3215.
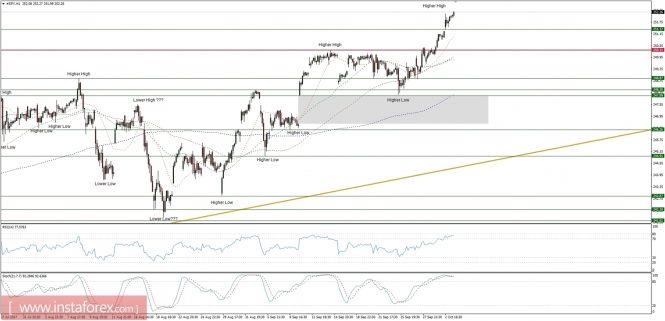
Market Snapshot: SPY on all-time highs again
The price of SPY (SP500 EFT) has hit the new all-time high again at the level of 252.26 points. The series of higher highs and higher lows still clearly indicates that the uptrend is in progress and so far there is no sign of any reversal. The next technical support is seen at the level of 251.37, but the most important one is seen at the level of 250.31.
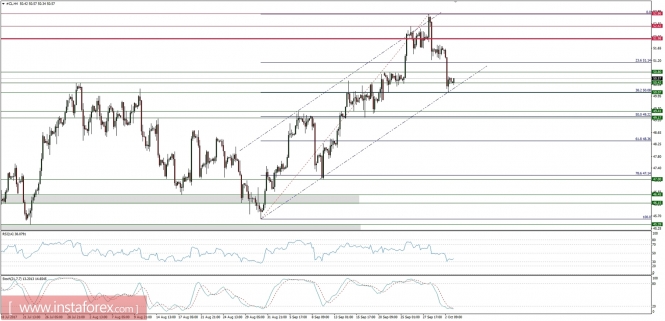
Market Snapshot: Crude Oil retraces 38% of the recent rally
The price of Crude Oil has retreated 38% of the recent rally from $45.50 to $52.86. This level was the lower channel boundary line as well, so it created a good support for the price. The oversold market conditions are indicating a possible correction to the level of $50.80 or even $51.20.