
GBP/USD continues to extend losses across the markets and now it is forming a lower low pattern on the H1 chart. The support zone of 1.3209 is now being challenged and if it gives up to the bears' force, the pair could touch the 1.3121 level. To the upside, gains should be limited by the 200 SMA. The MACD indicator still remains in favor of the bulls.
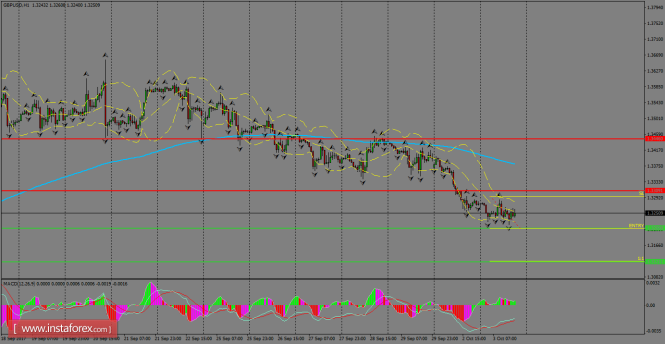
H1 chart's resistance levels: 1.3309 / 1.3446
H1 chart's support levels: 1.3209 / 1.3121
Trading recommendations for today: Based on the H1 chart, sell (short) orders only if the GBP/USD pair breaks a bearish candlestick; the support level is at 1.3209, take profit is at 1.3121 and stop loss is at 1.3294.
The material has been provided by InstaForex Company - www.instaforex.com