
Technical outlook:
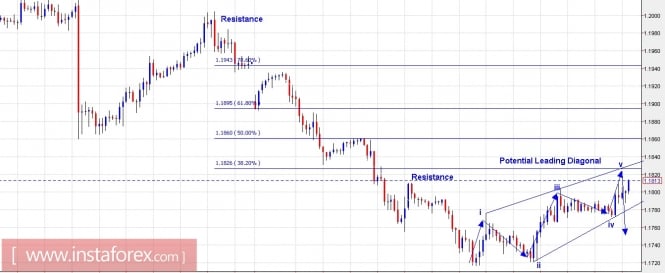
The EUR/USD pair might be producing a potential leading diagonal as presented here on the hourly chart. Initial fibonacci resistance comes in at 1.1820 levels and a pullback is expected from here. Besides, the diagonal structure would be complete around 1.1820 which calls for a pullback lower towards 1.1775 levels before continuing the rally. Please note that this could still be considered as a counter trend rally which should face resistance higher. On the other hand if this wave counts fails then EUR/USD could drop lower one more time towards 1.1670/80 levels before continuing higher. In any case, it is strongly advised to look to sell at higher levels rather than attempting counter trends. Resistance begins from the 1.1895 levels and extends through 1.1950 respectively.
Trading plan:
Please look to sell higher towards 1.1900/50 and 1.2000 levels, stop at 1.2200 and higher, target lower towards 1.1500 at least.
GBP/USD chart setups:
Technical outlook:
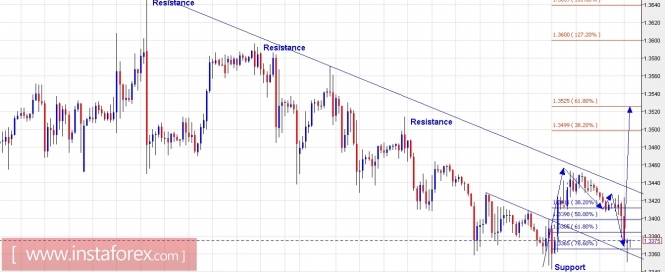
A short term wave count and setup looks to be on the higher side in GBPUSD as presented on the hourly chart here. The pair has dropped lower towards 1.3351 levels today before pulling back higher and a push above 1.3420 levels would confirm and accelerate higher. Please also note that GBP/USD had broken above its immediate resistance trend line yesterday forming a tiny impulse wave between 1.3341 and 1.3455 levels. Today it has retraced lower and has tested the backside of the same trend line which is acting as support now. By all probabilities if this wave count holds true, then prices should stay above 1.3341 levels and this rally should continue higher towards 1.3525/35 levels at least. Also note that potential remains for a push towards 1.3630 and higher levels as well.
Trading plan:
Aggressive: Remain long low, stop below 1.3341, target 1.3525
Conservative: Please look to sell higher towards 1.3535 levels, stop above 1.3700 and target lower.
Fundamental outlook:
Watch out for Canada's GDP figures and US Personal Consumption Expenditure figures at 08:30 AM EST today.
Good luck!
The material has been provided by InstaForex Company - www.instaforex.com