
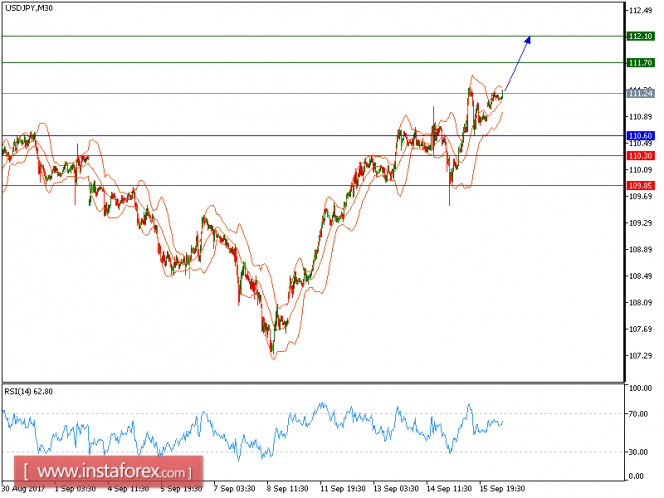
All our upside targets which we predicted in the previous analysis has been hit. USD/JPY is expecter to advance further and post some new highs. The pair posted a gap up when opening and broke above the 20-period moving average. The rising 50-period moving average suggests that the prices have potential for a further upside. The relative strength index is calling for a new upleg.
To sum up, as long as 110.60 holds on the downside, look for another advance with targets at 111.70 and 112.10 in extension.
Alternatively, if the price moves in the opposite direction, a short position is recommended below 110.60 with a target at 110.30.
Chart Explanation: The black line shows the pivot point. The current price above the pivot point indicates a bullish position, while the price below the pivot point is a signal for a short position. The red lines show the support levels and the green line indicates the resistance level. These levels can be used to enter and exit trades.
Strategy: BUY, Stop Loss: 110.60, Take Profit: 111.70
Resistance levels: 111.70, 112.10, and 112.55 Support Levels: 110.30, 109.85, 109.05
The material has been provided by InstaForex Company - www.instaforex.com