MG Network

something big isHappening!

In the mean time you can connect with us with via:

Copyright © Money Grows Network | Theme By Gooyaabi Templates

Money Grows Network

Archive

Powered by Blogger.

Welcome To Money Grows Network

Verified By

2006 - 2019 © www.moneygrows.net

Investments in financial products are subject to market risk. Some financial products, such as currency exchange, are highly speculative and any investment should only be done with risk capital. Prices rise and fall and past performance is no assurance of future performance. This website is an information site only.

Popular

Pages

Expert In

Name*


Message*

Ichimoku indicator analysis of gold for September 18, 2017

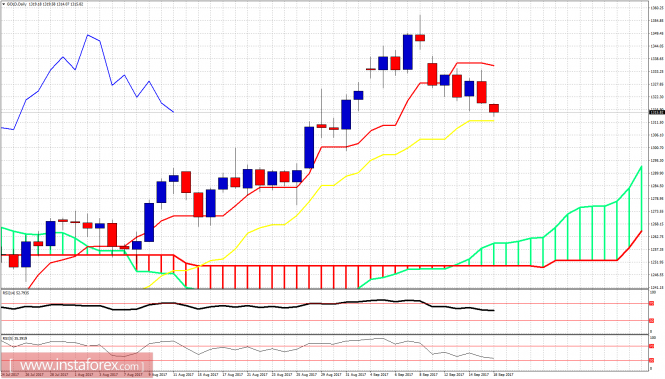
Gold price remains in a bearish short-term trend. The inability last week to break above the resistance at $1,335 and the rejection, confirmed that we are heading towards our next pull back target of $1,310-$1,280. My longer-term view remains bullish.

analytics59bf6d7239fdc.jpg

Black line - resistance

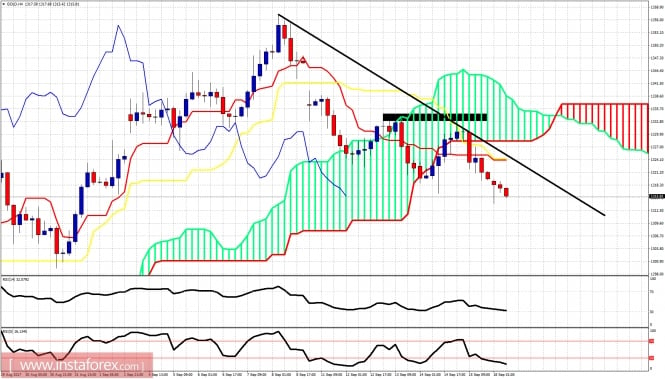
Black rectangle - horizontal resistance

Gold price is trading below the 4-hour Kumo. Price got rejected at the horizontal resistance last week. Short-term, resistance is now at $1,324 and next at $1,330-35. Trend is bearish in the short term as long as price is below $1,335. Gold is in a corrective phase.

analytics59bf6dceb48cb.png

Gold is moving slowly and steadily towards the daily kijun-sen as expected. We mentioned when price broke below the daily tenkan-sen (red line indicator) that we should expect a move towards the kijun-sen (yellow line indicator) as long as price is below the tenkan-sen. A break below the kijun-sen will open the way for a deeper correction towards cloud support. My longer-term view remains bullish and I continue to see this pullback as a buying opportunity.The material has been provided by InstaForex Company - www.instaforex.com