MG Network

something big isHappening!

In the mean time you can connect with us with via:

Copyright © Money Grows Network | Theme By Gooyaabi Templates

Money Grows Network

Archive

Powered by Blogger.

Welcome To Money Grows Network

Verified By

2006 - 2019 © www.moneygrows.net

Investments in financial products are subject to market risk. Some financial products, such as currency exchange, are highly speculative and any investment should only be done with risk capital. Prices rise and fall and past performance is no assurance of future performance. This website is an information site only.

Popular

Pages

Expert In

Name*


Message*

Ichimoku indicator analysis of gold for September 6, 2017

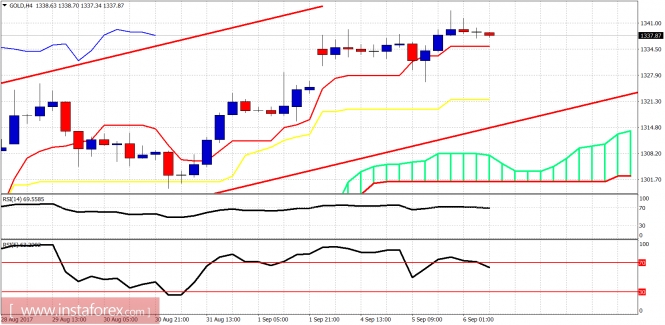
Gold price is very close to our second target of $1,350. Trend is bullish but also fragile for a pullback towards $1,300. Longer-term view remains bullish targeting above $1,400.

analytics59af9e501fc81.jpg

Gold price is trading above the 4-hour tenkan-sen (Red line indicator). Trend is bullish as price is making higher highs and higher lows. RSI (5) is diverging providing warning signals. Support is at $1,334 and resistance at $1,350.

analytics59af9ec1b6e41.jpg

Magenta line- resistance

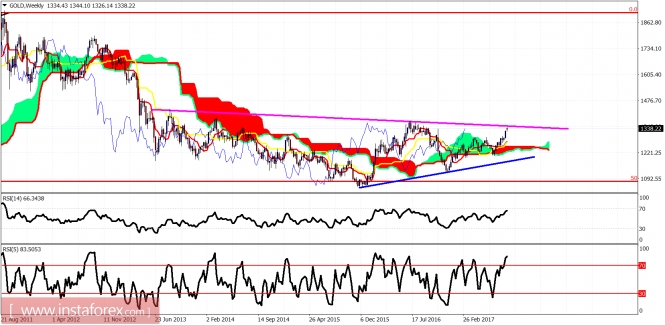
Blue line -long-term support

Gold price is above the weekly Kumo and with RSI (5) making new highs. Trend is clearly bullish on a weekly basis and we have a short-term target of $1,350 after our first at $1,320 was achieved. A pullback towards $1,300 is possible before the break out towards $1,400. Longer-term view remains bullish.

The material has been provided by InstaForex Company - www.instaforex.com