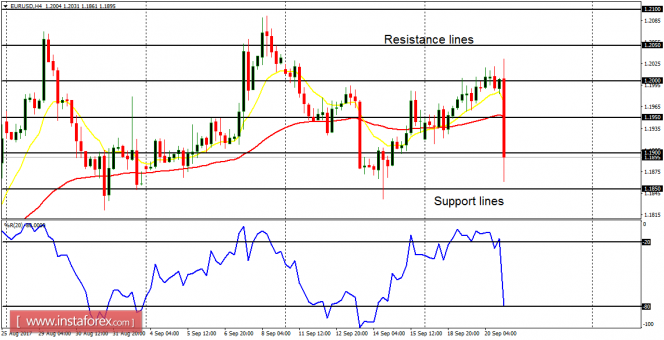
EUR/USD: The EUR/USD pair nosedived yesterday, but that was not significant enough to put an end to the recent neutrality in the market. For a bearish bias to form, there is a need for price to go below the support line at 1.1850. Otherwise, a rally from here would simply put more emphasis on the recent neutrality in the market.
USD/CHF: The USD/CHF pair shot upwards on Wednesday, but that was not significant enough to put an end to the recent neutrality in the market. For a bullish bias to form, price has to go above the resistance level at 0.9700. Otherwise, a bearish correction from here would simply put more emphasis on the recent neutrality in the market.

GBP/USD: In spite of the general consolidation in this market, the pair remains bullish. There should soon be a rise in momentum, which would most probably favor bulls. Certain fundamental figures are expected today and they may have some impact on the market.

USD/JPY: The USD/JPY pair went sharply upwards on Wednesday – to corroborate the existing bullishness in the market. Price is now above the demand level at 112.00, and almost reaching the supply level at 112.50. Other supply levels at 113.00 and 113.50 may also be reached before a meaningful reversal happens.

EUR/JPY: This is a bullish market; in spite of what is happening on it right now. There is a Bullish Confirmation Pattern in the market. The EMA 11 is above the EMA 56, and the RSI period 14 is above the level 50. There is a possibility of a further bullish movement before the expected reversal in the market happens (this week or early next week).