
The Dollar index remains in a bearish trend making lower lows and lower highs. Price is at the same levels it was back in May of 2016 and major support area. Oscillators are in oversold territory but not diverging in the weekly charts, implying that even a strong bounce will be a shorting opportunity.
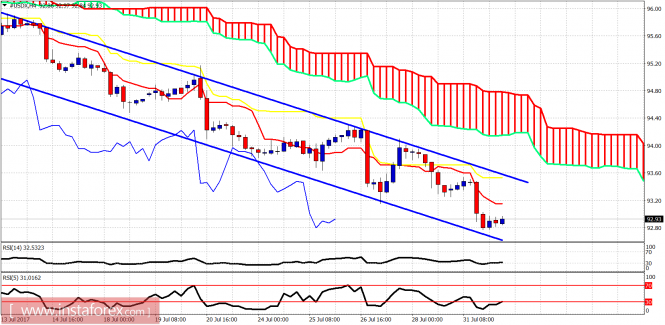
The Dollar index remains inside the bearish short-term channel and below both the tenkan- and kijun-sen. Price cannot break above and out of the channel. Short-term resistance is at 93.20 and next at 93.60. A break above 93.60 will push price towards 94.
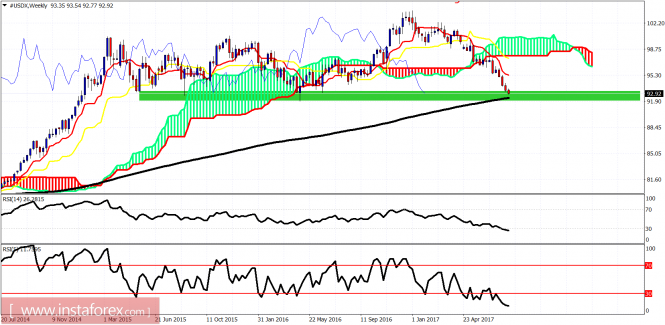
The weekly candle has entered the weekly support area and is approaching the 200 MA at 92.32. This is a huge support. Oscillators are oversold. A bounce is hugely justified. Minimum bounce target is at 95.30. Bears need to lower their stops and be cautious.
The material has been provided by InstaForex Company - www.instaforex.com