
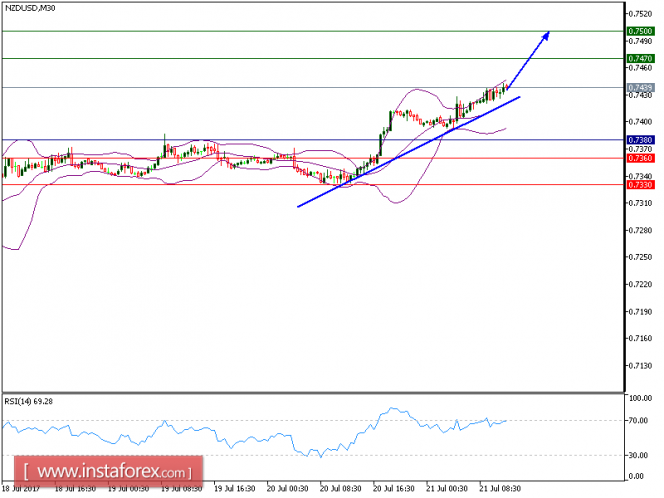
Both of our targets have been hit which we predicted in yesterday's analysis. NZD/USD is still expected to trade in a higher range as the pair is trading above the trend line. The pair accelerated on the upside after breaking above the upper boundary of the bearish channel. The upward momentum is further reinforced by the rising 20-period and 50-period moving averages. The relative strength index is bullish and calls for further advance.
Hence, as long as 0.7380 holds on the downside, look for a new advance to 0.7470 and even to 0.7500 in extension.
Strategy: BUY Stop Loss: 0.7380 Take Profit: 0.7470
Chart Explanation:
The black line shows the pivot point. Currently, the price is above the pivot point which indicates the bullish position. If it is below the pivot points, it indicates the short position. The red lines show the support levels and the green line indicates the resistance levels. These levels can be used to enter and exit trades.
Resistance levels: 0.7470, 0.7500, and 0.7545
Support levels: 0.7360, 0.7330, and 0.7285
The material has been provided by InstaForex Company - www.instaforex.com