
The pair has pulled back from the 200 SMA area at H1 chart and it's currently finding support at the 1.2839 level, amid USD weakness. Overall, as long as GBP/USD remains below that moving average, we might expect a bearish continuation to test the 1.2756 level following a breakout of the 1.2839 zone. MACD indicator supports the downside, as it remains in the negative territory.
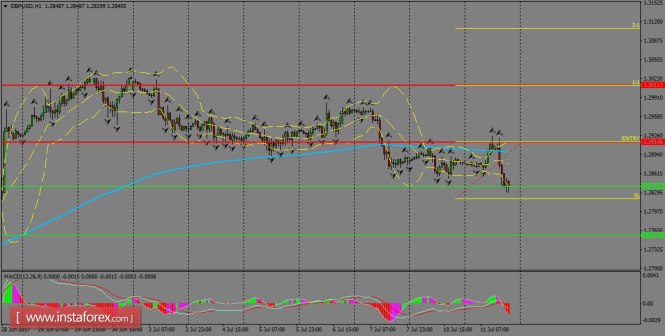
H1 chart's resistance levels: 1.2914 / 1.3011
H1 chart's support levels: 1.2839 / 1.2756
Trading recommendations for today: Based on the H1 chart, buy (long) orders only if the GBP/USD pair breaks a bullish candlestick; the resistance level is at 1.2914, take profit is at 1.3011 and stop loss is at 1.2818.
The material has been provided by InstaForex Company - www.instaforex.com