
Technical outlook:
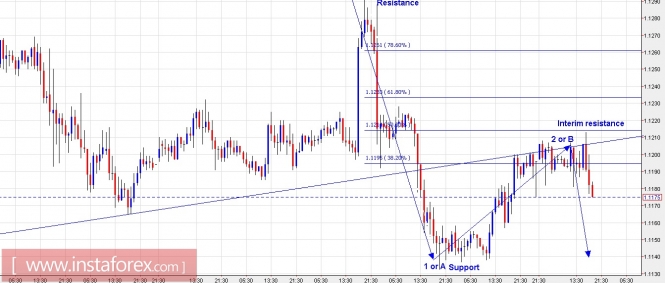
The EUR/USD pair looks to be ready for yet another leg lower. It seems to have hit the back side of immediate support line at 1.1200/10 levels and also re-tested the resistance today before reversing. Looking at the wave structure, the pair looks to have completed waves A or 1 and B or 2 as labelled here and should be poised for a wave C or 3 lower from here. It looks to be dropping lower at least till 1.1000 levels going forward. Please note that the pair might be in a wave 4 correction of a higher degree before it could turn higher again. It looks wise to remain on the short side for now with risk above 1.1300 levels. Besides, note that prices have reversed lower from fibonacci 0.50 resistance levels for now but we are not ruling out a possibility of a last leg rally through 1.1230 levels before turning lower again.
Trading plan:
Please remain short for now, with stop above 1.1300, targeting 1.1000
GBPUSD chart setups:
Technical outlook:
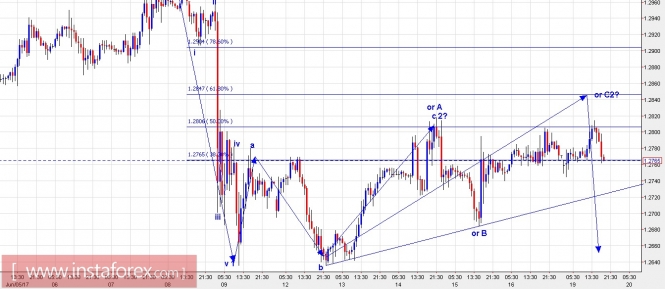
The GBP/USD pair has completed its counter trend rally around 1.2820 levels as discussed earlier. Furthermore, prices have also tested resistance and reversed lower today. Still, a possibility remains for an extended rally towards 1.2840/50 levels, which is fibonacci 0.618 resistance of the entire drop between 1.2970 through 1.2635 levels respectively, before prices resume lower. As labelled on the hourly chart here, a drop is possible either from current levels or from 1.2840/50 levels respectively. Looking at the wave count as well the pair might have completed wave 2 last week and wave 3 should resume any moment now. A break below the counter trend support line here would accelerate lower. Resistance remains at 1.2970 levels and till GBP/USD is below that, bears are expected to take control back.
Trading plan:
Remain short from here, stop above 1.2970 levels, target 1.2300.
Fundamental outlook:
The Brexit negotiations kick off today, so watch out for a higher volatility on GBP/USD.
Good luck!
The material has been provided by InstaForex Company - www.instaforex.com