Trading plan for 19/06/2017:
On Monday morning the strongest currency was NZD (+0.2%), NOK (+0.1%), and SEK (+0.1%), while the weakest was JPY (-0.15%) and AUD (-0,12%). EUR/USD is trading around 1.1200 and USD/JPY around 111.00. The Asian stock market was dominated by the positive sentiment, so Hang Seng is up 1.0%, Nikkei 226 is up 0.6% and Shanghai Composite is up 0.5%.
On Monday 19th of June 2017, the event calendar is light with any important news release, so let's take a look at the dynamics of major pairs and possible setups to trade.
GBP/USD analysis for 19/06/2017:
On Monday, the negotiations between the EU and Great Britain on Brexit are underway. In an atmosphere of growing ethnic or interreligious tension, the UK is about to leave the European community. As you know, this direction has a strong opposition in Scotland. The Scottish nationalists would prefer to torment Brexit by gaining independence within the EU. Premier Theresa May recently played high, because she proposed the early parliamentary elections. She won, but not as much as she planned. However, in terms of the intentions and the image enhancing - she lost. Therefore, Brexit is likely to have a milder or "incomplete" character. The so-called "hard" Brexit would mean breaking up with access to the single market and leaving the customs union. The price would probably be the free movement of people between the UK and the rest of the Eurozone.
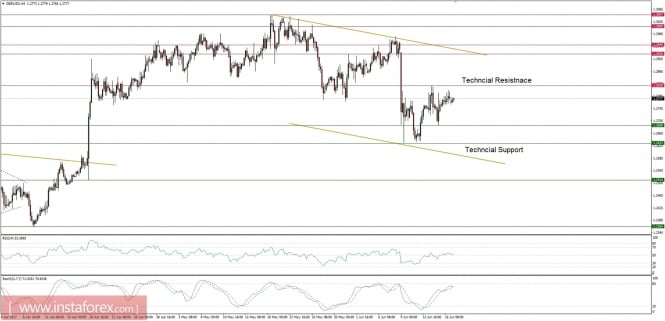
Meanwhile, GBP/USD is trading at the level of 1.2770. Indeed, it is slightly higher than the lows of 12-13 June but still low in relation to the pre-election value, as it was then surged to above 1.29. Nevertheless, the pair is still trading inside of a narrow range between technical resistance at the level of 1.2818 and technical support at the level of 1.2633. Only a clear, impulsive breakout above or below any of these levels would give more clues regarding a further direction of this pair.
EUR/USD analysis for 19/06/2017:
The Euro recorered a little in relation to what it had lost last week after the FOMC interest rate decision and further outlooks for the FED's monetary policy. The situation is not quite clear because the US dollar might gain some more, but the price shouldn't break the most general tendency, visible since the beginning of the year. If the ECB finally gives clearer signals for tougher policies, then EUR/USD is expected to break out above the 1.1300 level. The reason behind this bullish view lies in the recent change of the political situation in France. Emmanuel Macron is the new French president and his party, La Republique en Marche, also won the parliament, eliminating Socialists party and the National Front party. Emmanuel Macron's party won 355 seats in the 577-member National Assembly, giving support to reforms planned by the French president and this is being viewed as positive by global investors. Moreover, theoretically, such a turn of events should put pressure on the ECB to slowly abandon the extraordinary QE measures.
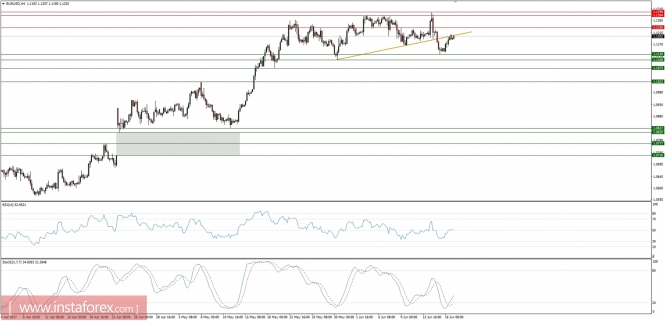
Let's take a look at the EUR/USD technical picture on the H4 time frame. The price is slowly trying to regain the momentum by testing the golden trend line resistance from below. The oversold market conditions are helping bulls so far, but the momentum indicator is still hovering around the fifty level, so it does not indicate a strong bullish pressure. The next support is seen at the level of 1.1130 - 1.1108 and the next resistance is seen at the level of 1.1236 and 1.1298.
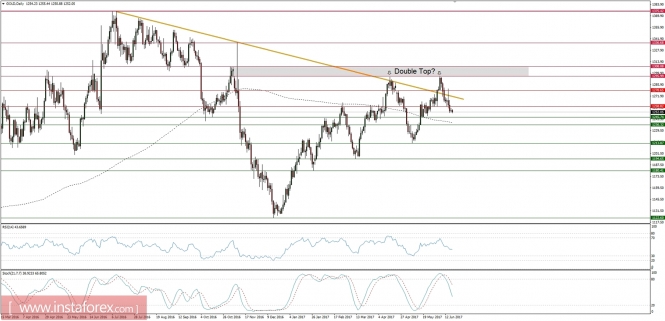
Market Snapshot: possible Double Top formation on Gold
The price of Gold had reversed after the last week FOMC interest rate decision and now is trading below the technical support at the level of $1,259. Moreover, there is a technical pattern of Double Top at the level of $1,296 possible, but to confirm this scenario, the price must break down below the 200 DMA at the level of $1,238. The market condicitons are neutral, but the oscillator is clearly turnind to south. The next support is seen at the level of $1,245.