
Technical outlook:
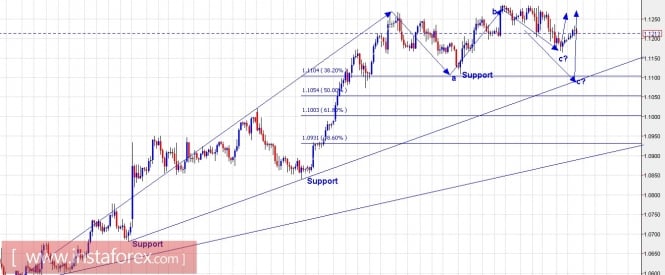
The EUR/USD pair continues to drift within a trading range broadly between 1.1150 and 1.1250 levels for now. As shown on the 4-hour time frame, the pair might have either completed its correction at 1.1150/60 last week or should be looking to retest lows at 1.1100 levels before terminating and resuming rally again. Please note that fibonacci 0.382 support and an intermediary trend line support is also converging at around the same levels, hence a bullish bounce is quite possible there. As an alternative though, the pair could be forming a running flat and already bottomed out at 1.1150/60 levels last week. In this case we should see further higher highs in the making. At least for now, staying flat would make good sense and give time to evaluate waves properly,
Trading plan:
Please remain flat for now and wait for another signal to trade.
GBPUSD chart setups:
Technical outlook:
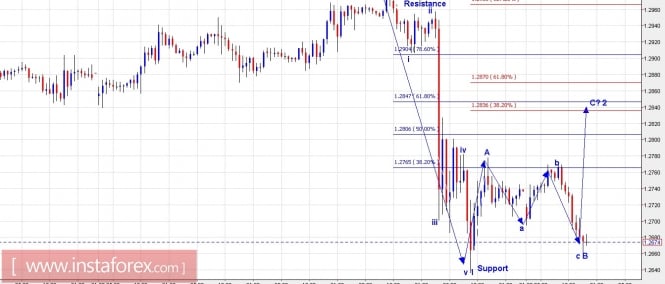
The GBP/USD pair is probably looking to produce an up gartley, which should push prices towards 1.2840/50 levels in the near term. The pair is seen to be trading at 1.2665 levels at this moment and till the time it remains above 1.2635 levels, we should be looking to see a sharp rally towards 1.2840/50 levels at least. Looking at the wave structure as well on the hourly chart, the pair has already dropped 5 waves from 1.2980 levels last week. Furthermore, it looks like waves A and B have also completed as a counter-trend rally is expected through higher levels. If this scenario holds true, we should see a sharp looking wave C rally towards 1.2840/50 levels before GBP/USD resumes lower again. On the flip side, a continued drop below 1.2635 levels would cancel the bullish counter-trend scenario.
Trading plan:
Aggressive traders look to remain long now, stop below 1.2635 and target 1.2840/50.
Fundamental outlook:
There is no major fundamental event lined up for the day. But in the coming days we shall be having the Fed bringing in more volatility.
Good luck!
The material has been provided by InstaForex Company - www.instaforex.com