
Overview:
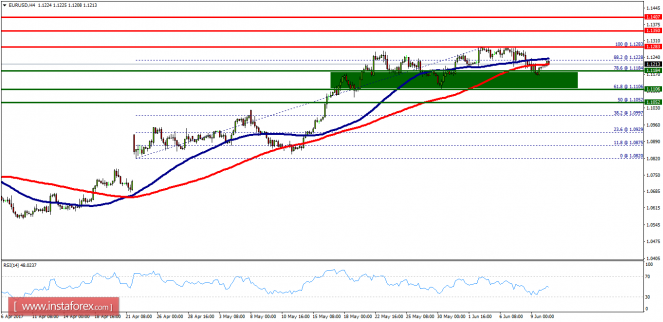
- The EUR/USD pair continues to rise from the level of 1.1184 in the long term. It should be noted that the support is established at the level of 1.1106, which represents the 61.8% Fibonacci retracement level on the H4 chart. Since the trend is above the 61.8% Fibonacci level, the market is still in an uptrend The price is likely to form a double bottom on the same time frame. Accordingly, the EUR/USD pair is showing signs of strength following a breakout of the highest level of 1.1240. So, buy above the level of 1.1240 with the first target at 1.1283 in order to test the daily resistance 1 and further to 1.1350. Also, it might be noted that the level of 1.1350 is a good place to take profit because it will form a new double top. However, it would also be sage to consider where to place a stop loss; this should be set above the second resistance of 1.1106. On the other hand, in case a reversal takes place and the EUR/USD pair breaks through the support level of 1.1184, a further decline to 1.1106 can occur which would indicate a bearish market.