
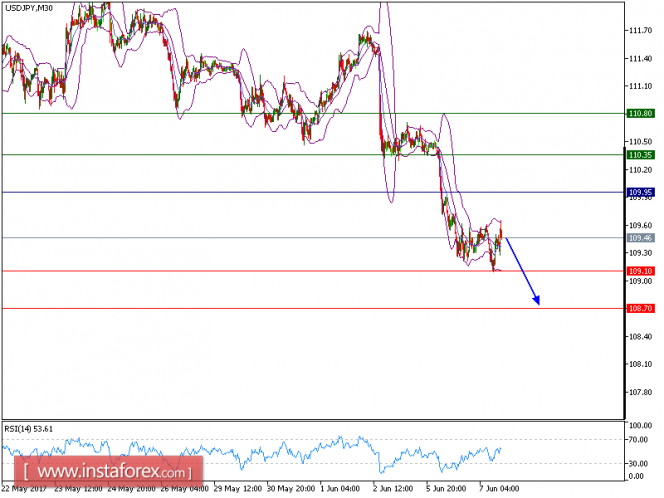
As predicted in yesterday's analysis, the pair moved lower and hit a target at 109.10. Today, the pair is still under pressure and expected to break yesterday's low. The pair is still on the downside, capped by its falling 50-period moving average. The nearest resistance at 109.95 maintains the strong selling pressure on the pair. Besides, the relative strength index remains weak below its neutrality area at 50.
In this case, as long as 109.95 is not surpassed, the pair is likely to decline to 109.10 at first. A break below 109.10 would trigger a further drop towards 108.70.
The pair moved as predicted yesterday and all our targets have been hit. At present, the pair is trading below its pivot point. It is likely to trade in a lower range as long as it remains below the pivot point. Short position is recommended with the first target at 109.10. A break below this target will move the pair further downwards to 108.70. The pivot point stands at 109.95. If the price moves in the opposite direction and bounces back from the support level, it will move above its pivot point. It is likely to move further to the upside. According to that scenario, long positions are recommended with the first target at 110.35 and the second one at 110.80.
Graph Explanation: The black line shows the pivot point, the present price above pivot point indicates the bullish position and below pivot points indicates the short position. The red lines shows the support levels and the green line indicates the resistance levels. These levels can be used to enter and exit trades.
Strategy: SELL at highs, Stop Loss: 109.95, Take Profit: 109.10
Resistance levels: 110.35, 110.85, and 111.05
Support levels: 109.00, 108.70, and 111.55
The material has been provided by InstaForex Company - www.instaforex.com