
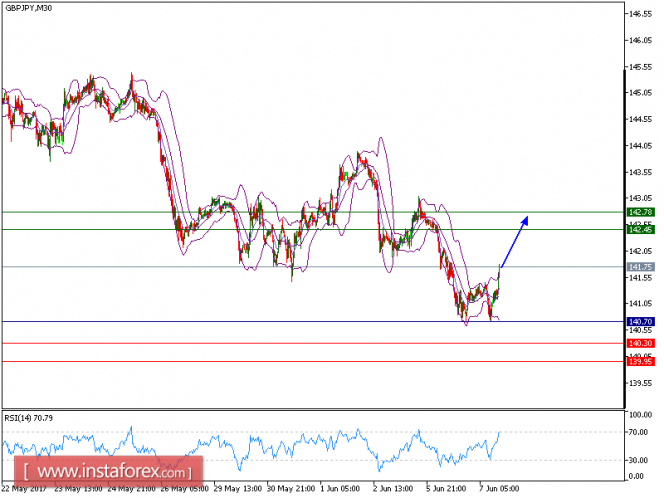
Yesterday, GBP/JPY moved lower as predicted. Today, the pair is making rebound from its support of 140.70 and expected to continue its rebound. The pair is expected to trade with a bullish bias above 140.70. The pair is trading above the rising 50-period moving average, which plays a support role and maintain the upside bias. The relative strength index is above its neutrality level at 50. The key support at 140.70 should limit the downside potential.
To conclude, as long as this key level is not broken, a rebound to 142.45 and even to 142.78 seems more likely to occur.
At present, the pair is trading above its pivot point. It is likely to trade in a higher range as long as it remains above its pivot point. Therefore, long position is recommended with the first target at 142.45 and the second one at 142.78. In the alternative scenario, short position is recommended with the first target at 140.30 if the price moves below its pivot points. A break of this target is expected to push the pair further downwards, and one may expect the second target at 139.95. The pivot point lies at 140.70.
Graph Explanation: The black line shows the pivot point, present price above pivot point indicates the bullish position and below pivot points indicates the short position. The red lines shows the support levels and the green line indicates the resistance levels. These levels can be used to enter and exit trades.
Strategy : BUY at dips, Stop Loss: 140.70, Take Profit: 142.45
Resistance levels: 142.45, 142.78, and 143.35
Support levels: 140.30,139.95, and 139.50
The material has been provided by InstaForex Company - www.instaforex.com