
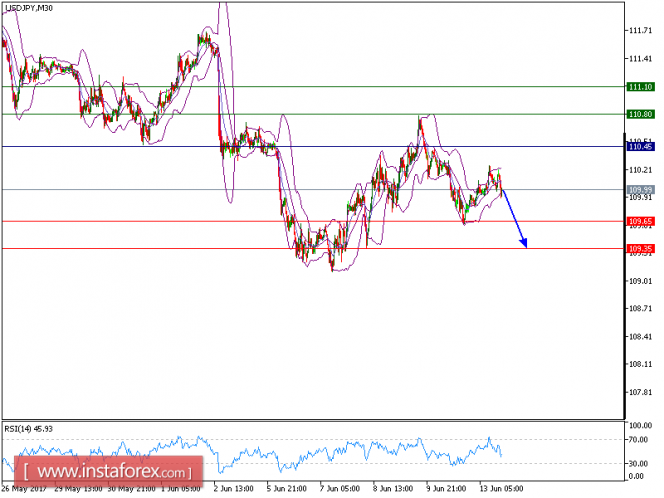
USD/JPY is expected to trade in a lower range as key resistance is seen at 110.45. The technical picture of the pair remains bearish below its declining 50-period moving average, which is playing a resistance role. The relative strength index is below its neutrality level at 50 and lacks upward momentum. Even though a continuation of a technical rebound cannot be ruled out, its extent should be limited.
As long as 110.45 holds on the upside, look for a further drop toward 109.65 and even 109.35 in extension.
Alternatively, if price moves in the opposite direction as predicted, long position is recommended above 110.45 with targets at 109.65 and 109.35.
Graph Explanation: The black line shows the pivot point, present price above pivot point indicates the bullish position and below pivot points indicate the short position. The red lines show the support levels and the green line indicates the resistance levels. These levels can be used to enter and exit trades.
Strategy : SELL, Stop Loss: 110.45, Take Profit: 109.65
Resistance levels: 120.80, 111.10, and 111.45
Support levels: 109.65,109.35, and 109
The material has been provided by InstaForex Company - www.instaforex.com