
Daily Outlook
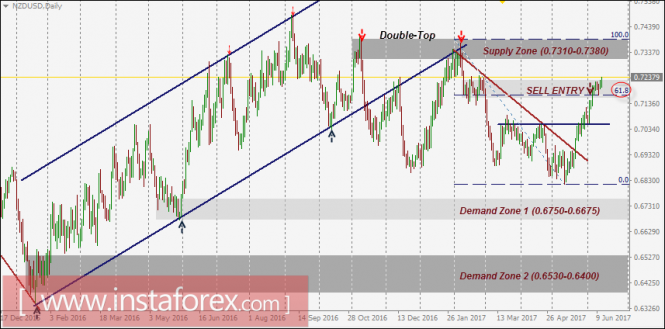
The NZD/USD pair has been trending up within the depicted bullish channel since January 2016.
In November 2016, early signs of bullish weakness were expressed on the chart when the pair market failed to record a new high above 0.7400.
Bearish breakout of the lower limit of the channel took place in December 2016.
In February 2017, the depicted short-term downtrend was initiated off the depicted supply zone (0.7310-0.7380).
However, a recent bullish breakout above the downtrend line took place on May 22. Since then, the market has been bullish as depicted on the chart.
The temporary bearish rejection was expressed around 0.7050 (previous daily tops) before further advance was pursued towards 0.7120.
The price zone of 0.7150-0.7220 stands as a prominent supply zone in confluence with Fibonacci level 61.8%. That's why bearish rejection should be anticipated within the current price zone.
Recent Update: Temporary bullish rejection was expressed around 0.7170 resulting in the daily candlestick of Monday (Hanging Man).
Daily candlestick closure above 0.7230 (Upper Limit of the current SELL zone) opens the way for an advance towards the next supply zone around 0.7310-0.7380.
Trade recommendations:
Conservative traders can wait for a breakout of the current zone. Bearish closure below 0.7150 (61.8% Fibo level) indicates a valid SELL signal.
S/L should be placed above 0.7250 while T/P levels should be placed at 0.7050, 0.6970, and 0.6850.
On the other hand, bullish breakout above 0.7230 invalidates the bearish scenario allowing further bullish advance towards 0.7310-0.7380.
The material has been provided by InstaForex Company - www.instaforex.com