
The Dollar index stopped its rise and has pulled back towards the previous resistance area for a backtest. A successful backtest and bounce will confirm the bullish short-term trend. A break back below the previous resistance will be a bearish sign.
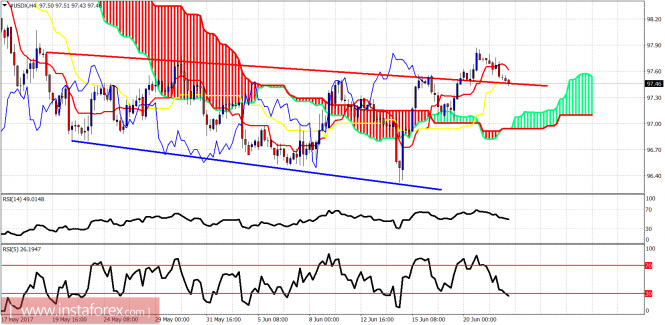
The Dollar index is breaking below the 4-hour kijun-sen and is back testing the broken red trend line resistance. Price is above the 4-hour Kumo. As long as it holds above 97, bulls will remain alive. However a break below the red trend line will not be a good sign.
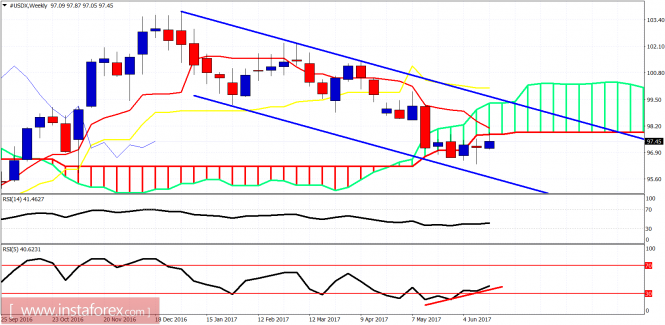
The weekly candle has touched the weekly Kumo (cloud) lower boundary and got rejected. This is not a good sign. Bulls need to break above this week's high in order to bounce towards our short-term target of 98.50. Inability to retake yesterday's high will open the way for a new low below 96.50 before a bigger bounce comes. I'm not anymore that bullish for the short term as the 98.50 scenario is seriously being challenged.
The material has been provided by InstaForex Company - www.instaforex.com