
Technical outlook:
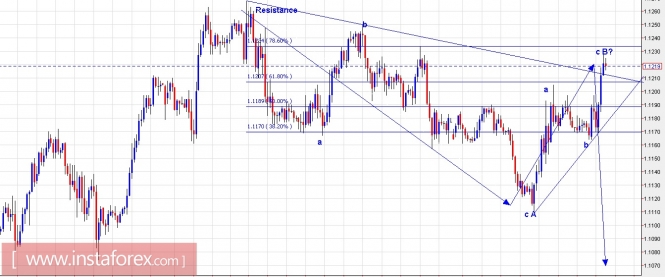
The EUR/USD continues to consolidate after hitting an interim high at 1.1263 levels last week. It looks more probable that the pair is into its second leg B, as labelled here, within the A-B-C correction. You can observe that the pair is stalling right at the trend line resistance and also the fibonacci 0.618 levels are into play now. The pair should be looking lower until prices remain below 1.1263 going forward. On the flip side, a break above 1.1263 would delay such developments and the pair would want to test 1.1300 levels before reversing lower again. For now, resistance is strong at 1.1263 and interim support is seen at 1.1110 levels respectively. Please note that a break below the counter trend line would accelerate a further decline. As to the wave pattern, it looks to be working out a 3-3-5 flat.
Trading plan:
Please remain short now, stop above 1.1263 levels targeting 1.1000.
GBPUSD chart setups:
Technical outlook:
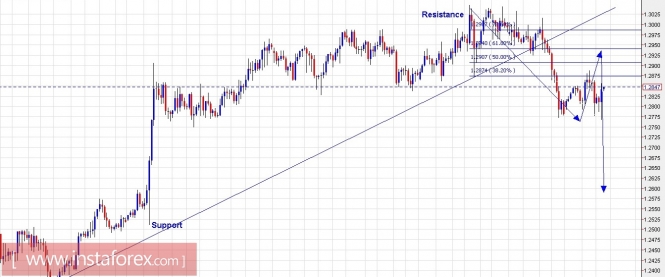
The GBP/USD pair's bearish story continues just in a while though. The pair seems to be pulling back/retracing a bit maybe towards 1.2900/50 levels, which is also fibonacci 0.618 resistance of the drop between1.3047 through 1.2770 levels respectively. The wave count indicates that GBP/USD might have just completed its wave 1 lower (not labelled) towards 1.2770 levels today before pulling back. The current rally is probably wave 2 and is expected to terminate around 1.2950 levels before wave 3 resumes lower again. Please also note that the pair has broken below its immediate trend line support and that prices are well into the sell zone for now. It makes good sense to prepare to sell again on intraday rallies through 1.2900/50 levels. Price resistance is seen at 1.3047 levels while interim support is at 1.2770 levels respectively.
Trading plan:
Sell around 1.2900/50, stop above 1.3047, target lower below 1.2770 levels.
Fundamental outlook:
With no major events for the rest of the day, expect markets to trade normally without higher volatility. The US Non-Farm Payrolls are due on June 02, 2017, so be ready for a good volatile day.
Good luck!
The material has been provided by InstaForex Company - www.instaforex.com