
GBP/USD woke up from the thin trading action witnessed on Monday's session and it's challenging the resistance zone of 1.2866. A breakout over there can help to extend the corrective move towards 1.2911, which is slightly above the 200 SMA at H1 chart. By the other hand, if the level of 1.2791 gives up, then a continuation lower should happen to test the 1.2718 level.
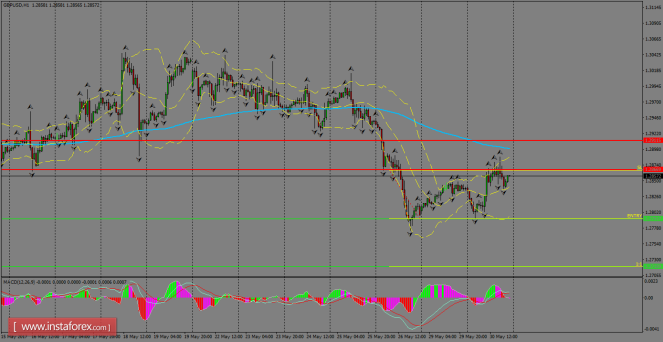
H1 chart's resistance levels: 1.2866 / 1.2911
H1 chart's support levels: 1.2791 / 1.2718
Trading recommendations for today: Based on the H1 chart, sell (short) orders only if the GBP/USD pair breaks a bearish candlestick; the support level is at 1.2791, take profit is at 1.2718 and stop loss is at 1.2865.
The material has been provided by InstaForex Company - www.instaforex.com