
Technical outlook:
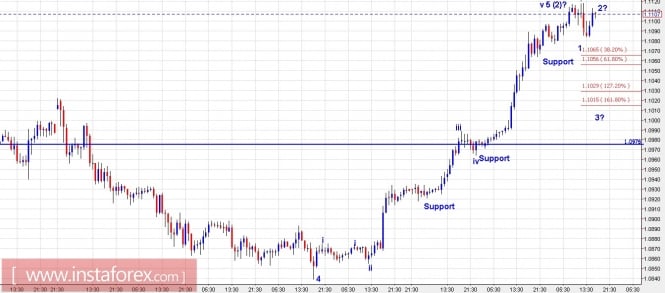
The EUR/USD pair pipped us out yesterday and printed new highs 100 pips higher at 1.1122 levels. The pair might have completed wave (2) at a larger degree now and it is also seen to be testing a trend line resistance (not shown here) at the moment. We shall take a cautious approach to initiate short positions but please watch out for any bearish signal around the current levels which could trigger a sell-off. Potential wave counts now could be waves 1 and 2 on the down side as labelled here and that wave 3 could possibly resume till prices stay below 1.1122 levels. Resistance is seen at 1.1122/30 levels while support is at 1.1063 levels respectively. Only if bearish confirmation is received around these levels, we would like to initiate short positions.
Trading plan:
Please remain flat for now but prepare to sell again on bearish signal confirmation, with risk above 1.1125 levels.
GBPUSD chart setups:
Technical outlook:
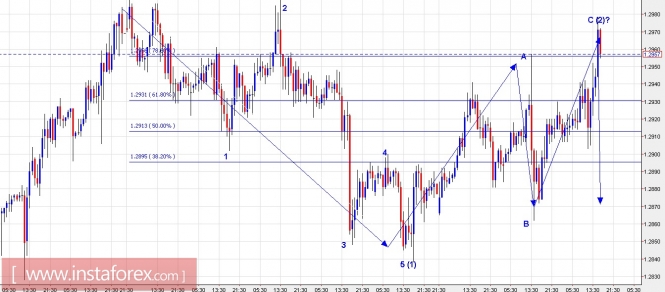
The GBP/USD pair looks to be ready with waves (1) and (2) as labelled on the hourly chart above. Please note that the drop from 1.2988 through 1.2838 levels looked impulsive while the rally turned out to be corrective in nature A-B-C. If prices remain below 1.2988 levels going forward, GBP/USD will be in for a drop much lower and deeper in the short term. At the moment, the structure looks to be quite convincing as wave (1) and (2) with bears expected to take control back from here on. Besides, prices are stalling at the fibonacci 0.786 resistance levels and a confirmed bearish signal here would warrant short positions or at least add to it. As an alternative though, a break above 1.2988 levels would indicate that bulls have not done yet with their counter trend termination.
Trading plan:
Please remain short with stop around 1.3010 levels. A target is open.
Fundamental outlook:
No major risk from fundamental events is lined up for the day.
Good luck!
The material has been provided by InstaForex Company - www.instaforex.com