
Overview:
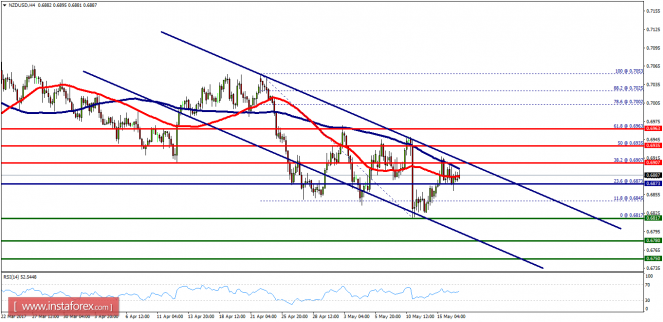
- The NZD/USD pair will keep to move downwards from the level of 0.6935 (resistance). The pair fell from the level of 0.6935, which coincides with the ratio of 50% Fibonacci retracement, to the bottom around 0.6817. The first resistance level is seen at 0.6873 (the daily pivot point) followed by 0.6907, while daily support 1 is found at 0.6817.
- Besides, the level of 0.6907 represents a weekly pivot point for that it is acting as minor resistance. Amid the previous events, the pair is still in a downtrend.
- The NZD/USD pair is declining from the new resistance line of 0.6907 towards the first support level at 0.6817 in order to test it. Hence, we recommend to sell below 0.6907 with the first target at 0.6718 in order to test yesterday's bottom.
- If the pair succeeds to pass through the level of 0.6817, the market will indicate a bearish opportunity below the level of 0.6817 in order to continue towards the next objectives of 0.6780 and 0.6750. However, if a breakout happens at the resistance level of 0.6907, for that you should set your stop loss at 0.6935.