
Technical outlook:
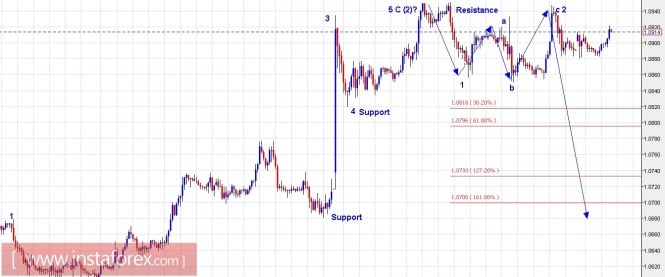
The EUR/USD pair seems to have produced a meaningful top at 1.0950 levels last week at last, or is very close to forming it. Looking at the wave count, the rally from 1.0580 levels looks to be completed by 5 waves as labelled here, terminating the wave (2) intermediate as well. Furthermore, waves 1 and 2 within the intermediate wave (3) are also looking complete now. By all probabilities, wave 3 should be produced to allow prices go lower towards 1.0700 levels at least. Please watch out for a sequence of lower lows and lower highs being produced till prices remain below 1.0950 levels respectively. Immediate support is seen at 1.0820 levels, while resistance lies at 1.0950 levels. A safe trading strategy is to keep selling on rallies.
Trading plan:
Please remain short with stop above 1.2950 levels, targeting 1.0580 and lower.
GBP/USD chart setups:
Technical outlook:
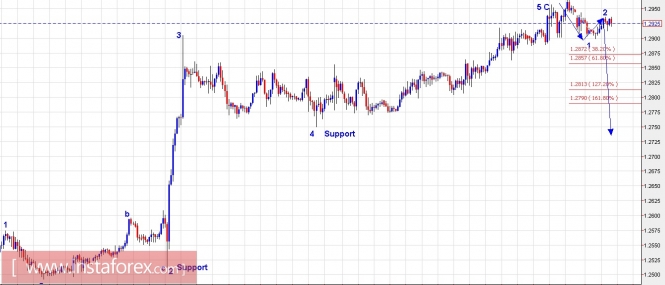
The GBP/USD pair finally tops and reverses from 1.2960/70 levels as we had been waiting since last week. The pair has completed its wave counts as well by pushing 5 waves from 1.2360 levels and then turning lower again. Please also note that GBP/USD might have already completed waves 1 and 2 of the next big drop, which is expected to unfold into 5 waves and push prices lower towards at least 1.2000 levels if not further. Until prices remain below Friday's highs at 1.2964 levels, please look for lower lows from here. On the flip side, a consistent break above 1.2970 levels will push the price to try and test 1.30 and 1.31 levels, which looks less probable at this moment. The immediate support is seen at 1.2750 levels while the resistance is found at 1.1965 levels.
Trading plan:
Please remain short now with stop above 1.2965 levels, targeting lower.
Fundamental outlook:
Please watch out for the USD ISM Manufacturing to be out at 10:00 a.m. EST today for some volatility.
Good luck!
The material has been provided by InstaForex Company - www.instaforex.com