
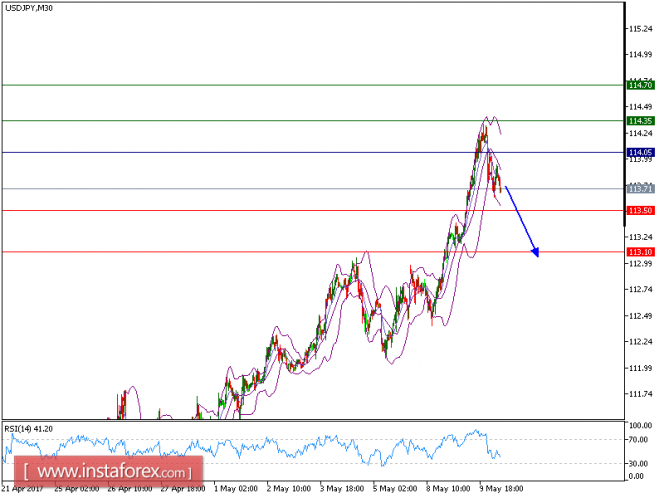
USD/JPY is turning down. The pair failed to break above its nearest resistance at 114.05, and is now extending its losses. The process of lower highs and lows has been confirmed on the chart. Besides, the relative strength index is bearish and calls for a further downside. To conclude, as long as 114.05 is not surpassed, look for a new pullback to 113.50 and 113.10 in extension.
To sum up, as long as 112.85 is not broken, the pair is likely to advance to 113.45 and then to 113.65.
The pair is trading below its pivot point. It is likely to trade in a lower range as long as it remains below the pivot point. Short positions are recommended with the first target at 113.50. A break below this target will move the pair further downwards to 113.10. The pivot point stands at 114.05. If the price moves in the opposite direction and bounces back from the support level, it will move above its pivot point. It is likely to move further to the upside. According to that scenario, long positions are recommended with the first target at 114.35 and the second one at 114.70.
Resistance levels: 114.35, 114.70, and 115.00
Support levels: 113.50, 113.10, and 112.65
The material has been provided by InstaForex Company - www.instaforex.com