
USDX continues to strengthen in the short term and it's approaching the 100.00 handle. With a consolidation above the 200 SMA at H1 chart, we can expect further rallies to reach that psychological zone. As the current move was done within an impulse, a pullback can happen towards the support zone of 99.23. MACD indicator is turning flat, calling for sideways in the index.
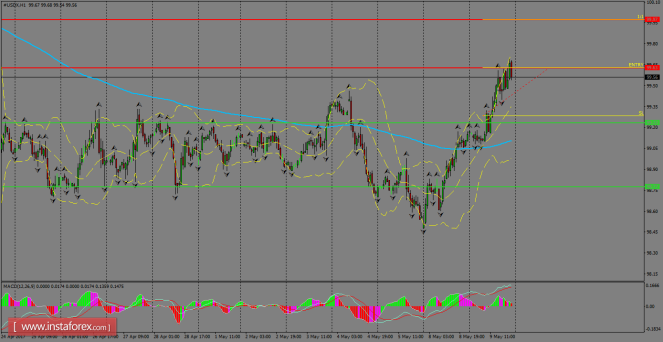
H1 chart's resistance levels: 99.63 / 99.97
H1 chart's support levels: 99.23 / 98.77
Trading recommendations for today: Based on the H1 chart, place buy (long) orders only if the USD index breaks a bullish candlestick; the resistance level is at 99.63, take profit lies at 99.97 and stop loss is at 99.28.
The material has been provided by InstaForex Company - www.instaforex.com