
Gold price broke below short-term support and is now testing a weekly cloud and technical support at $1,235. This is a great opportunity and a gift for Gold bulls as I believe the low we are about to make will be of equal importance to $1,180 and $1,194.
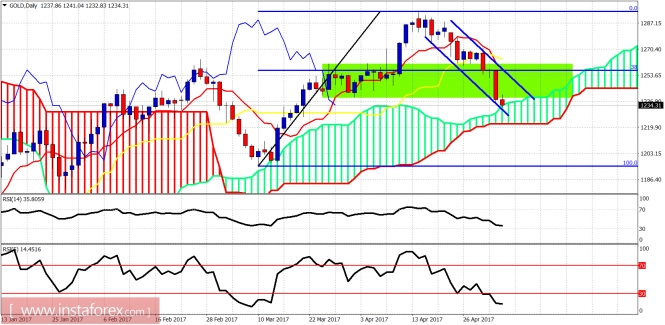
Green rectangle - support area
Gold price is testing daily cloud support. The last time the RSI (5) was this oversold Gold was trading at $1,194-$1,200. We all remember what followed. Gold is above the cloud and trend remains bullish but bulls will also need to provide signs of strength by breaking above and out of the bearish channel.
Purple line - support
Green line - projection
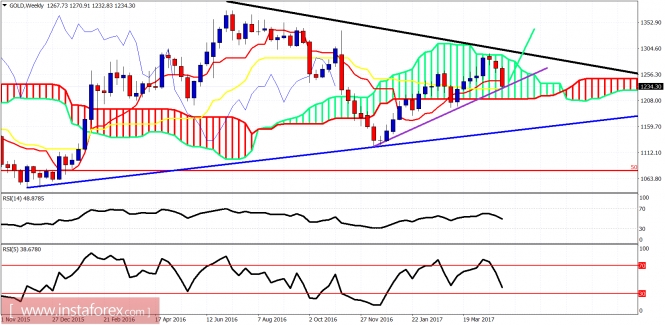
The weekly Gold chart shows Gold still inside the Kumo which implies that the weekly trend is neutral. Gold is testing the weekly kijun-sen (yellow line indicator) that coincides with the purple upward sloping trend line support. This is an important junction for Gold. I remain longer-term bullish.
The material has been provided by InstaForex Company - www.instaforex.com